
Description: Tools & Technologies; This project was developed using SQL Server, Python, Power BI, and Tableau, with a strong focus on Product Analytics, E-commerce Analytics, Customer Behavior, Funnel Analysis, and A/B Testing. Throughout the project, I used the following tools and analytical techniques:
SQL Server
- Database Design and Development
- Database Schema
- Relational Tables
- Primary Keys and Foreign Keys
- Relationships and Constraints
- Database Normalization (3NF)
- ER Diagram
- Data Dictionary
- AI-Generated Dataset
- CSV Data Files
- SQL Scripts
- Data Cleaning and Transformation
- Joins and Subqueries
- Common Table Expressions (CTEs)
- Window Functions
- Views
- Stored Procedures and Functions
- KPI and Business Analysis
- Funnel and Conversion Analysis
Python
- Data Cleaning and Preparation
- Exploratory Data Analysis (EDA)
- Pandas and NumPy
- Data Manipulation
- Functions and Variables
- Statistical Analysis
- Customer and Session Segmentation
- Funnel and Drop-off Analysis
- Conversion Analysis
- A/B Test Analysis
- Statistical Significance Testing
- Confidence Intervals
- Data Visualization
Power BI
- Data Modeling
- Table Relationships
- DAX Measures
- KPI Development
- Interactive Dashboards
- Product and Customer Analytics
- Funnel Analysis
- Conversion and Revenue Analysis
- Data Visualization
- Business Insights and Reporting
Tableau
- Data Preparation
- Calculated Fields
- KPIs
- Interactive Dashboards
- Data Visualization
- Charts and Graphs
- Search Performance Analysis
- Customer Behavior Analysis
- Product Performance Analysis
- Funnel Visualization
- A/B Test Result Visualization
A/B Testing & Experimentation
- Experiment Design
- Business Hypothesis Development
- Control and Treatment Groups
- Random Assignment
- Primary and Guardrail Metrics
- Sample Analysis
- Conversion Rate Comparison
- Absolute and Relative Uplift
- Statistical Significance
- Confidence Intervals
- Experiment Result Interpretation
- Product Recommendations
Product & E-commerce Analytics
- Customer Journey Analysis
- Search and Product Discovery Analysis
- Search CTR
- Zero-Result Search Rate
- Search-to-Purchase Conversion
- Product View Rate
- Add-to-Cart Rate
- Checkout Rate
- Purchase Conversion Rate
- Funnel Drop-off Analysis
- Revenue per Session
- Revenue per User
- Average Order Value (AOV)
- Customer and Session Segmentation
- High-Engagement / Low-Conversion Segment Analysis
- Product, Brand, and Category Performance
The project follows an end-to-end analytical workflow:
Database Design → Data Generation → SQL Analysis → Data Exploration → Product & Search Analytics → Funnel Analysis → Segmentation → A/B Testing → Dashboard Development → Business Recommendations
Title:
ShopSense, E-commerce Product & Customer Analytics
Project Overview:
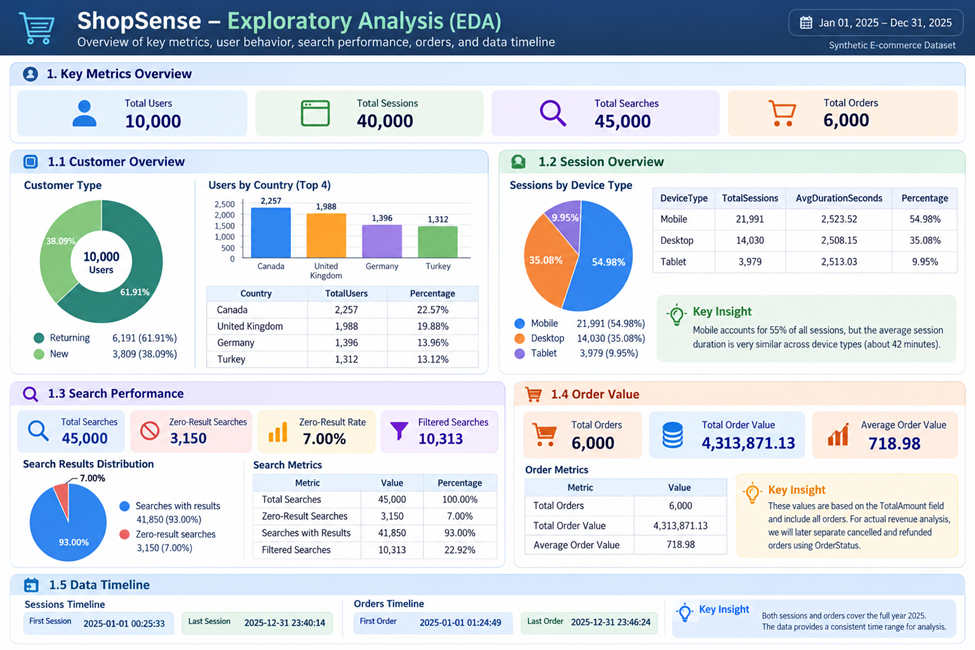
Summery:
ShopSense is a fictional e-commerce analytics project designed to simulate a real-world product discovery and customer journey environment. The project focuses on understanding how users interact with an online store from their initial search through product discovery, product engagement, cart activity, checkout, and final purchase.
The primary objective of the project is to investigate an important product analytics question:
Why do some users demonstrate strong search and product engagement but fail to convert into customers?
To answer this question, ShopSense is structured as an end-to-end product analytics case study, combining database design, SQL analysis, Python analytics, business intelligence dashboards, customer segmentation, funnel analysis, and A/B testing.
Project Objectives
The project is designed to analyze the complete customer journey and identify behavioral patterns that influence conversion and revenue.
The main objectives are to:
Measure user engagement throughout the product discovery journey.
Analyze the Search → Product View → Add to Cart → Checkout → Purchase funnel.
Identify stages with the highest user drop-off.
Evaluate the effectiveness of product search and discovery.
Identify search queries or customer segments with high engagement but unexpectedly low conversion.
Analyze relationships between search behavior, product interaction, conversion, and revenue.
Measure key product and e-commerce metrics such as Search CTR, Add-to-Cart Rate, Checkout Rate, Conversion Rate, Search Exit Rate, Revenue per Session, and Revenue per User.
Segment users and sessions based on behavioral and commercial characteristics.
Design and analyze A/B experiments to determine whether changes to the product discovery experience generate statistically meaningful improvements.
Translate analytical findings into actionable product and business recommendations.
Database Design Approach
The ShopSense database is designed to reproduce the event-driven structure commonly found in modern e-commerce platforms.
Rather than storing only customers and transactions, the database captures the sequence of interactions that occur throughout a user’s shopping journey.
The data model follows the customer lifecycle:
User → Session → Search → Product Discovery → Product View → Cart → Checkout → Order
Each stage generates analytical data that can be connected through relational keys. This structure makes it possible to reconstruct individual customer journeys and analyze where users progress, abandon the funnel, or convert.
The database is organized around several major subject areas:
Customer & Session Data
Stores user profiles, acquisition information, devices, geographic attributes, and browsing sessions.
Product & Catalog Data
Contains products, categories, brands, pricing, inventory-related attributes, and other information required to analyze product performance.
Search & Product Discovery Data
Captures search queries, search results or impressions, result positions, clicks, and zero-result searches. This area enables analysis of search effectiveness and product discovery behavior.
Behavioral Event Data
Records important customer actions such as product views, add-to-cart events, cart removals, checkout initiation, and other funnel interactions.
Transaction Data
Stores orders, order items, quantities, prices, discounts, and revenue information, allowing behavioral activity to be connected directly with commercial outcomes.
Experimentation Data
Stores A/B test assignments and experiment-related information so that user behavior and business outcomes can be compared between Control and Treatment groups.
Analytical Structure
The database will support several connected layers of analysis.
At the descriptive level, SQL and BI tools will be used to calculate KPIs and understand overall product, search, customer, and revenue performance.
At the behavioral level, funnel and segmentation analysis will identify where different groups of users experience friction.
At the diagnostic level, SQL and Python will be used to investigate why highly engaged users sometimes fail to purchase and determine which search queries, products, devices, acquisition channels, or customer segments contribute most strongly to conversion loss.
At the experimental level, A/B testing will evaluate proposed improvements to the product discovery experience using statistical measures such as conversion uplift, confidence intervals, and statistical significance.
Finally, the findings will be transformed into business and product recommendations, connecting technical analysis directly to measurable outcomes such as improved conversion, reduced funnel abandonment, and increased revenue.
Project Workflow
The complete analytical workflow follows:
Database Design → Data Generation → SQL Analysis → Exploratory Analysis → Funnel Analysis → Customer Segmentation → A/B Testing → Dashboard Development → Business Recommendations
The project will use SQL Server, Python, Power BI, and Tableau, with GitHub serving as the final portfolio repository for database scripts, analytical queries, notebooks, dashboards, documentation, and project findings.
The final result will demonstrate not only how e-commerce data can be queried and visualized, but how product analytics can be used to move from a business problem to evidence-based decisions and measurable product improvements.
ShopSense Database Overview
The ShopSense Database is a relational e-commerce analytics database designed to simulate how users interact with an online shopping platform throughout the complete product discovery and purchasing journey.
The database captures customer activity from the moment a user enters the platform and starts a browsing session through search, product discovery, product views, cart interactions, checkout, and purchase.
Unlike a traditional transactional database that focuses primarily on customers, products, and orders, ShopSense also captures behavioral events and experimentation data. This enables deeper analysis of customer behavior, search effectiveness, funnel performance, conversion, revenue, and A/B testing.
The database is designed around the following analytical journey:
User → Session → Search → Search Results / Impressions → Product View → Cart → Checkout → Purchase
Additional product, marketing, and experimentation data are connected to this journey to provide the context required for advanced product analytics.
Database Subject Areas
The database is organized into seven logical subject areas.
1. Customer Management
Stores information about registered and guest users interacting with the ShopSense platform.
Main Table:
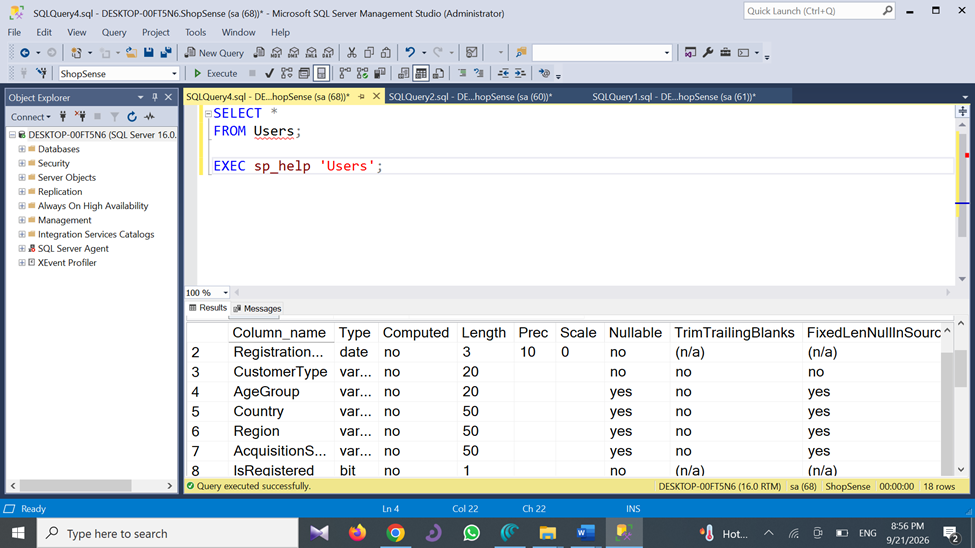
Users
Typical attributes include:
- User ID
- Registration Date
- Customer Type
- Age Group
- Country
- Region
- Acquisition Source
This information allows customer behavior and conversion to be analyzed across different user segments.
2. Session & Traffic Management
Tracks individual visits to the ShopSense platform.
Main Table:
Sessions
Each session represents a user’s interaction with the platform during a specific visit.
Session data can include:
- Session ID
- User ID
- Session Start
- Session End
- Device Type
- Traffic Source
- Campaign
- Landing Page
Sessions provide the foundation for calculating metrics such as **Conversion Rate, Revenue per Session, Search Usage Rate, and Session Engagement.
3. Product & Catalog Management
Stores the products available through ShopSense and their organizational structure.
Main Tables:
Categories
Brands
Products
Product information can include:
- Product ID
- Product Name
- Category
- Brand
- Price
- Discount
- Rating
- Stock Status
These tables allow product performance to be analyzed across categories, brands, price ranges, and other commercial characteristics.
4. Search & Product Discovery
Captures how customers search for and discover products.
Main Tables:
Searches
SearchImpressions
SearchClicks
The search layer records:
- Search Query
- Search Timestamp
- Number of Results
- Product Impressions
- Search Result Position
- Product Clicks
- Click Position
This structure enables analysis of important product discovery metrics including:
Search CTR
Zero-Result Search Rate
Search Exit Rate
Search-to-Product-View Rate
Search-to-Purchase Conversion Rate
It also allows us to investigate whether users are finding relevant products and whether high search engagement ultimately leads to purchases.
5. Customer Behavioral Events
Tracks important actions that occur after product discovery.
Main Tables:
ProductViews
CartEvents
CheckoutEvents
These events allow the customer journey to be reconstructed as:
Search → Product View → Add to Cart → Checkout → Purchase
Cart events can distinguish between actions such as:
- Add to Cart
- Remove from Cart
- Quantity Change
This structure makes detailed funnel and drop-off analysis possible.
6. Orders & Revenue
Stores completed transactions and purchased products.
Main Tables:
Orders
OrderItems
Order-level information can include:
Order ID
User ID
Session ID
Order Date
Order Status
Total Amount
Discount Amount
Shipping Amount
OrderItems connect individual products to each transaction and enable analysis of:
Revenue
Average Order Value
Units Sold
Product Revenue
Category Revenue
Revenue per User
Revenue per Session
7. Experimentation & A/B Testing
Stores information required to simulate and analyze product experiments.
Main Tables:
Experiments
ExperimentVariants
ExperimentAssignments
An experiment can compare two or more versions of a product experience.
For example:
Control (A): Existing search ranking experience
Treatment (B): Improved personalized product ranking
Users or sessions are assigned to experiment variants and their subsequent behavior can be compared.
This enables analysis of:
Conversion Rate
Search CTR
Add-to-Cart Rate
Revenue per Session
Experiment Uplift
Confidence Intervals
Statistical Significance
The experimentation layer allows ShopSense to move beyond descriptive analytics and evaluate whether proposed product changes produce measurable improvements.
Proposed Database Structure
The initial ShopSense database will contain approximately 16 core relational tables:
1. Users
2. Sessions
3. Categories
4. Brands
5. Products
6. Searches
7. SearchImpressions
8. SearchClicks
9. ProductViews
10. CartEvents
11. CheckoutEvents
12. Orders
13. OrderItems
14. Experiments
15. ExperimentVariants
16. ExperimentAssignments
Additional supporting tables can be introduced later only when they provide meaningful analytical value.
Core Database Relationships
The central analytical structure of the database follows:
Users
↓
Sessions
↓
Searches
↓
SearchImpressions
↓
SearchClicks
↓
ProductViews
↓
CartEvents
↓
CheckoutEvents
↓
Orders
↓
OrderItems
At the same time:
Categories → Products
Brands → Products
and:
Experiments → ExperimentVariants → ExperimentAssignments → Users / Sessions
Together, these relationships make it possible to connect who the customer is, how they arrived, what they searched for, which products they discovered, how they interacted with those products, whether they entered the purchasing funnel, whether they converted, and how much revenue they generated.
Analytical Capabilities
The ShopSense database is designed to support:
Customer Analytics: user behavior, customer segmentation, new vs. returning users and acquisition analysis.
Search Analytics: search queries, zero-result searches, search CTR, ranking position, search engagement and search-to-purchase conversion.
Product Analytics: product views, clicks, cart activity, product conversion and product/category performance.
Funnel Analytics: Search → View → Cart → Checkout → Purchase conversion and drop-off analysis.
Revenue Analytics: revenue, AOV, revenue per user/session and product/category contribution.
Segmentation Analysis: behavioral, acquisition, device, product and search-based customer segments.
Experimentation Analytics: control vs. treatment comparison, uplift measurement and statistical testing.
The database therefore provides the foundation for an end-to-end analytics workflow using SQL Server, Python, Power BI, and Tableau.
ShopSense, Database Schema:
Database Design Strategy
The database is designed to maintain Third Normal Form (3NF) wherever it is practical, while avoiding unnecessary complexity for Product Analytics. This approach creates a clean, scalable, and analytics-friendly database that supports efficient querying, reporting, and dashboard development.
1. Users
The Users table stores the core information for each customer and serves as the primary entity for user-related analytics throughout the database. It contains the foundational user profile data that connects to orders, sessions, reviews, wishlists, and other customer activities.
| Column | Data Type | Key | Description |
| —————– | ———– | — | ————————— |
| UserID | INT | PK | Unique user identifier |
| RegistrationDate | DATE | | Registration date |
| CustomerType | VARCHAR(20) | | New / Returning |
| AgeGroup | VARCHAR(20) | | Customer age segment |
| Country | VARCHAR(50) | | Country |
| Region | VARCHAR(50) | | Region/state |
| AcquisitionSource | VARCHAR(50) | | Original acquisition source |
| IsRegistered | BIT | | Registered vs guest |
| IsActive | BIT | | Active customer status |
Note: Sensitive personal information such as Name, Email, and Phone Number is intentionally excluded, as this project focuses on user behavior and product analytics rather than personally identifiable information (PII).
2. Sessions
Records each user session and activity within the ShopSense platform.
| Column | Data Type | Key | Description |
| ———————- | ———— | — | ———————————— |
| SessionID | BIGINT | PK | Unique session |
| UserID | INT | FK | → Users.UserID |
| SessionStart | DATETIME2 | | Session start |
| SessionEnd | DATETIME2 | | Session end |
| DeviceType | VARCHAR(20) | | Desktop / Mobile / Tablet |
| TrafficSource | VARCHAR(50) | | Organic, Paid, Direct, Social, Email |
| Campaign | VARCHAR(100) | | Marketing campaign |
| LandingPage | VARCHAR(100) | | First page |
| Browser | VARCHAR(30) | | Browser |
| SessionDurationSeconds | INT | | Session duration |
Users 1 → N Sessions
3. Categories
Product Category Structure
| Column | Data Type | Key | Description |
| —————- | ———— | — | ———————– |
| CategoryID | INT | PK | Category identifier |
| CategoryName | VARCHAR(100) | | Category name |
| ParentCategoryID | INT | FK | → Categories.CategoryID |
| IsActive | BIT | | Active status |
The ParentCategoryID field allows us to create hierarchical category structures, such as:
Electronics → Headphones
4. Brands
| Column | Data Type | Key | Description |
| ————— | ———— | — | —————- |
| BrandID | INT | PK | Brand identifier |
| BrandName | VARCHAR(100) | | Brand |
| CountryOfOrigin | VARCHAR(50) | | Origin |
| IsActive | BIT | | Active status |
5. Products
One of the most important dimension tables in the project.
| Column | Data Type | Key | Description |
| ————— | ————- | — | ——————— |
| ProductID | INT | PK | Product identifier |
| ProductName | VARCHAR(150) | | Product name |
| CategoryID | INT | FK | → Categories |
| BrandID | INT | FK | → Brands |
| ListPrice | DECIMAL(10,2) | | Standard price |
| DiscountPercent | DECIMAL(5,2) | | Current discount |
| Rating | DECIMAL(3,2) | | Product rating |
| ReviewCount | INT | | Number of reviews |
| StockQuantity | INT | | Available inventory |
| IsActive | BIT | | Product availability |
| CreatedDate | DATE | | Product creation date |
Relationships:
Categories 1 → N Products
Brands 1 → N Products
Search & Product Discovery
Records each search query performed by a user.
| Column | Data Type | Key | Description |
| ————— | ———— | — | —————————— |
| SearchID | BIGINT | PK | Unique search |
| SessionID | BIGINT | FK | → Sessions |
| SearchQuery | VARCHAR(255) | | Query entered |
| SearchTimestamp | DATETIME2 | | Search time |
| ResultsCount | INT | | Number of results |
| SearchType | VARCHAR(30) | | Keyword / Category / Suggested |
| FiltersApplied | BIT | | Whether filters were used |
| SortOption | VARCHAR(30) | | Relevance / Price / Rating |
Relationship:
Sessions 1 → N Searches
ResultsCount = 0 will later be used directly to calculate the Zero-Result Rate.
7. SearchImpressions
Identifies which products were displayed to the user in the search results.
| Column | Data Type | Key | Description |
| ——————- | ——— | — | —————– |
| ImpressionID | BIGINT | PK | Unique impression |
| SearchID | BIGINT | FK | → Searches |
| ProductID | INT | FK | → Products |
| ResultPosition | INT | | Search ranking |
| ImpressionTimestamp | DATETIME2 | | Display time |
| IsSponsored | BIT | | Sponsored result |
A single search query can display, for example, 20 products:
Search 1001 → Product A position 1
Search 1001 → Product B position 2
Search 1001 → Product C position 3
This table will be essential for analyzing the impact of Ranking Position.
8. SearchClicks
Records each click on a search result.
| Column | Data Type | Key | Description |
| ————– | ——— | — | —————- |
| SearchClickID | BIGINT | PK | Click identifier |
| SearchID | BIGINT | FK | → Searches |
| ProductID | INT | FK | → Products |
| ClickTimestamp | DATETIME2 | | Click time |
| ClickPosition | INT | | Position clicked |
Using these three tables:
Searches → SearchImpressions → SearchClicks
we can analyze Search CTR, Ranking Performance, and Product Discovery.
Behavioral Events
9. ProductViews
| Column | Data Type | Key | Description |
| ——————- | ———– | ——— | —————————————– |
| ProductViewID | BIGINT | PK | View identifier |
| SessionID | BIGINT | FK | → Sessions |
| ProductID | INT | FK | → Products |
| SearchID | BIGINT | FK / NULL | Source search |
| ViewTimestamp | DATETIME2 | | View time |
| ViewDurationSeconds | INT | | Time on product page |
| SourcePage | VARCHAR(50) | | Search / Home / Category / Recommendation |
SearchID can be NULL because not every Product View necessarily originates from a search.
10. CartEvents
| Column | Data Type | Key | Description |
| ————– | ————- | — | —————————– |
| CartEventID | BIGINT | PK | Event identifier |
| SessionID | BIGINT | FK | → Sessions |
| ProductID | INT | FK | → Products |
| EventType | VARCHAR(20) | | Add / Remove / QuantityChange |
| Quantity | INT | | Quantity |
| UnitPrice | DECIMAL(10,2) | | Price at event |
| EventTimestamp | DATETIME2 | | Event time |
This design also enables analysis of the Add-to-Cart → Remove-from-Cart behavior.
11. CheckoutEvents
| Column | Data Type | Key | Description |
| ————— | ———– | — | —————————————- |
| CheckoutEventID | BIGINT | PK | Checkout event |
| SessionID | BIGINT | FK | → Sessions |
| EventType | VARCHAR(30) | | Started / Shipping / Payment / Completed |
| EventTimestamp | DATETIME2 | | Event time |
| PaymentMethod | VARCHAR(30) | | Payment method |
| ShippingMethod | VARCHAR(30) | | Shipping option |
Transaction Layer
12. Orders
| Column | Data Type | Key | Description |
| ————– | ————- | — | ——————————– |
| OrderID | BIGINT | PK | Order identifier |
| UserID | INT | FK | → Users |
| SessionID | BIGINT | FK | → Sessions |
| OrderDate | DATETIME2 | | Purchase time |
| OrderStatus | VARCHAR(30) | | Completed / Cancelled / Refunded |
| Subtotal | DECIMAL(12,2) | | Before adjustments |
| DiscountAmount | DECIMAL(10,2) | | Discount |
| ShippingAmount | DECIMAL(10,2) | | Shipping |
| TaxAmount | DECIMAL(10,2) | | Tax |
| TotalAmount | DECIMAL(12,2) | | Final amount |
13. OrderItems
| Column | Data Type | Key | Description |
| ————– | ————- | — | —————— |
| OrderItemID | BIGINT | PK | Item identifier |
| OrderID | BIGINT | FK | → Orders |
| ProductID | INT | FK | → Products |
| Quantity | INT | | Purchased quantity |
| UnitPrice | DECIMAL(10,2) | | Purchase price |
| DiscountAmount | DECIMAL(10,2) | | Item discount |
| LineTotal | DECIMAL(12,2) | | Item revenue |
Relationship:
Orders 1 → N OrderItems
This structure enables revenue analysis at the Product, Category, Brand, User, and Session levels.
Experimentation Layer
14. Experiments
| Column | Data Type | Key | Description |
| ————– | ———— | — | —————————– |
| ExperimentID | INT | PK | Experiment identifier |
| ExperimentName | VARCHAR(150) | | Experiment name |
| Description | VARCHAR(500) | | Business hypothesis |
| StartDate | DATE | | Start |
| EndDate | DATE | | End |
| PrimaryMetric | VARCHAR(100) | | Main KPI |
| Status | VARCHAR(20) | | Planned / Running / Completed |
For example:
Experiment: Personalized Search Ranking
Primary Metric: Search-to-Purchase Conversion Rate
15. ExperimentVariants
| Column | Data Type | Key | Description |
| —————— | ———— | — | ———————- |
| VariantID | INT | PK | Variant identifier |
| ExperimentID | INT | FK | → Experiments |
| VariantName | VARCHAR(50) | | Control / Treatment |
| VariantDescription | VARCHAR(300) | | Experience description |
| AllocationPercent | DECIMAL(5,2) | | Traffic allocation |
Relationship:
Experiments 1 → N ExperimentVariants
16. ExperimentAssignments
This table identifies which experiment variant each User/Session has been assigned to.
| Column | Data Type | Key | Description |
| ——————- | ——— | ——— | ——————— |
| AssignmentID | BIGINT | PK | Assignment identifier |
| ExperimentID | INT | FK | → Experiments |
| VariantID | INT | FK | → ExperimentVariants |
| UserID | INT | FK / NULL | → Users |
| SessionID | BIGINT | FK / NULL | → Sessions |
| AssignmentTimestamp | DATETIME2 | | Assignment time |
Using this table, we can link Control vs. Treatment assignments to all subsequent user events and behaviors.
Final Schema Architecture
The core Customer Journey will be structured as follows:
Users → Sessions → Searches → SearchImpressions / SearchClicks → ProductViews → CartEvents → CheckoutEvents → Orders → OrderItems
Alongside the main customer journey, the Product Dimension Structure will be:
Categories → Products ← Brands
The Experimentation Layer will be structured as:
Experiments → ExperimentVariants → ExperimentAssignments → Users / Sessions
ShopSense – Relationships, Primary Keys & Foreign Keys
In the ShopSense database design, there are three main types of relationships:
- 1:N (One-to-Many): the most common relationship type in the project
- Optional Relationship: used when a Foreign Key (FK) can be NULL
- Self-Relationship: used to create the hierarchical structure of Categories
1. Primary Keys
Each table will have a unique Primary Key (PK).
| Table | Primary Key | Data Type |
| ——————— | —————– | ——— |
| Users | `UserID` | INT |
| Sessions | `SessionID` | BIGINT |
| Categories | `CategoryID` | INT |
| Brands | `BrandID` | INT |
| Products | `ProductID` | INT |
| Searches | `SearchID` | BIGINT |
| SearchImpressions | `ImpressionID` | BIGINT |
| SearchClicks | `SearchClickID` | BIGINT |
| ProductViews | `ProductViewID` | BIGINT |
| CartEvents | `CartEventID` | BIGINT |
| CheckoutEvents | `CheckoutEventID` | BIGINT |
| Orders | `OrderID` | BIGINT |
| OrderItems | `OrderItemID` | BIGINT |
| Experiments | `ExperimentID` | INT |
| ExperimentVariants | `VariantID` | INT |
| ExperimentAssignments | `AssignmentID` | BIGINT |
The use of BIGINT for events, sessions, and transactions is intentional, as in a real-world system, the number of these records can grow significantly larger than dimension entities such as Brands and Categories.
2. Core Customer Relationships
Users → Sessions
Users
UserID PK
│
│ 1
│
└──────── N
Sessions
UserID FK
Relationship:
Users.UserID → Sessions.UserID
Cardinality: 1:N
3. Product Relationships
Categories → Products
PK: Categories.CategoryID
FK: Products.CategoryID
Cardinality: 1:N
Categories
│
│ 1
▼
N
Products
Each Category can contain multiple Products.
Brands → Products
PK: Brands.BrandID
FK: Products.BrandID
Cardinality: 1:N
Each Brand can have multiple Products, while each Product is associated with a single Brand in the current design.
4. Category Self-Relationship
In the Categories table, we have a special type of relationship:
PK: CategoryID
FK: ParentCategoryID
Categories
CategoryID PK
▲
│
ParentCategoryID FK
Cardinality: 1:N
For example:
Electronics
│
├── Headphones
├── Laptops
└── Smartphones
For a top-level category:
ParentCategoryID = NULL
For a subcategory such as Headphones:
ParentCategoryID = Electronics.CategoryID
This creates a Self-Referencing Relationship, allowing the Categories table to support a hierarchical category structure.
5. Sessions → Searches
PK: Sessions.SessionID
FK: Searches.SessionID
Cardinality: 1:N
A single Session may include multiple searches, for example:
Search 1: wireless headphones
Search 2: noise cancelling headphones
Search 3: bluetooth headphones
This relationship is important for calculating Searches per Session and analyzing Search Engagement.
6. Searches → SearchImpressions
PK: Searches.SearchID
FK: SearchImpressions.SearchID
Cardinality: 1:N
A single Search may generate, for example, 20 Product Impressions:
wireless headphones
SearchID 501
│
├── Product 101 – Position 1
├── Product 237 – Position 2
├── Product 415 – Position 3
└── …
7. Products → SearchImpressions
PK: Products.ProductID
FK: SearchImpressions.ProductID
Cardinality: 1:N
Therefore, SearchImpressions effectively connects Searches and Products:
Searches
│
│ 1
▼
N
SearchImpressions
N
▲
│ 1
Products
This design allows us to determine:
Which Product was displayed for each Search and at which Ranking Position.
8. Searches → SearchClicks
PK: Searches.SearchID
FK: SearchClicks.SearchID
Cardinality: 1:N
Products.ProductID → SearchClicks.ProductID
Cardinality: 1:N
Therefore, we can compare Impressions with Clicks and later calculate:
Search CTR = Clicks / Impressions
9. Sessions → ProductViews
PK: Sessions.SessionID
FK: ProductViews.SessionID
Cardinality: 1:N
Products.ProductID → ProductViews.ProductID
Cardinality: 1:N
Each Product can be viewed thousands of times by different users.
10. Searches → ProductViews — Optional
PK: Searches.SearchID
FK: ProductViews.SearchID
ProductViews.SearchID = NULL
A user may access a Product Page directly from:
Homepage
Category Page
Recommendation
Promotion
Therefore, not every ProductView necessarily originates from a Search.
This is an optional relationship:
0..1 Search → ProductView
11. Sessions → CartEvents
PK: Sessions.SessionID
FK: CartEvents.SessionID
Cardinality: 1:N
Products.ProductID → CartEvents.ProductID
Cardinality: 1:N
For example:
Session 8001
Product 105 → Add
Product 220 → Add
Product 105 → Remove
Product 310 → Add
This event-based structure will later enable us to analyze Cart Abandonment and Remove-from-Cart Behavior.
12. Sessions → CheckoutEvents
PK: Sessions.SessionID
FK: CheckoutEvents.SessionID
Cardinality: 1:N
For example:
Started
↓
Shipping
↓
Payment
↓
Completed
If a user reaches the Payment stage but does not reach Completed, it indicates a Checkout Drop-off.
13. Users → Orders
PK: Users.UserID
FK: Orders.UserID
Cardinality: 1:N
A Customer can place multiple Orders over time.
14. Sessions → Orders
PK: Sessions.SessionID
FK: Orders.SessionID
Cardinality: 1:N
This relationship is particularly important for Product Analytics because it connects each Purchase to the Session in which the conversion occurred.
This allows us to answer analytical questions such as:
Do sessions with Search activity generate a higher Conversion Rate?
or:
What is the Revenue per Search Session?
15. Orders → OrderItems
PK: Orders.OrderID
FK: OrderItems.OrderID
Cardinality: 1:N
For example:
Order 70001
│
├── Headphones × 1
├── Charger × 2
└── Case × 1
16. Products → OrderItems
PK: Products.ProductID
FK: OrderItems.ProductID
Cardinality: 1:N
so:
Orders
│
│ 1
▼
N
OrderItems
N
▲
│ 1
Products
This structure enables Revenue Analysis at the Product, Brand, and Category levels.
17. Experiments → ExperimentVariants
PK: Experiments.ExperimentID
FK: ExperimentVariants.ExperimentID
Cardinality: 1:N
For example:
Personalized Search Ranking
│
┌────┴────┐
│ │
Control Treatment
18. Experiments → ExperimentAssignments
PK: Experiments.ExperimentID
FK: ExperimentAssignments.ExperimentID
Cardinality: 1:N
Each Experiment can have multiple Assignments.
19. ExperimentVariants → ExperimentAssignments
PK: ExperimentVariants.VariantID
FK: ExperimentAssignments.VariantID
Cardinality: 1:N
For example:
Treatment
│
├── User 120
├── User 341
├── User 527
└── …
20. Users / Sessions → ExperimentAssignments
Here, we have an important design decision.
The ExperimentAssignments table includes:
UserID
SessionID
Both fields can be nullable, allowing an experiment to be conducted at either the User Level or the Session Level.
For example, for a User-Level Experiment:
UserID = 501
SessionID = NULL
For a Session-Level Experiment:
UserID = NULL
SessionID = 90051
This flexible design is particularly useful for practicing and analyzing different experimentation and A/B testing scenarios.
Final Relationship Map
Ultimately, the core database structure will be organized approximately as follows:
┌──────────── Brands
│
▼
Categories ───────────► Products
▲ │ │ │ │
│ │ │ │ └──────────────┐
└── ParentCategory │ │ │ │
│ │ │ │
▼ ▼ ▼ ▼
Users ──► Sessions ──► Searches ──► SearchImpressions
│ │ │ ▲
│ │ │ │
│ │ └──► SearchClicks
│ │
│ ├────────────► ProductViews
│ │
│ ├────────────► CartEvents
│ │
│ ├────────────► CheckoutEvents
│ │
│ └────────────► Orders ──► OrderItems
│ ▲
└────────────────────────────┘
Experiments
│
├────► ExperimentVariants
│ │
│ ▼
└────► ExperimentAssignments
▲
│
Users / Sessions
Summary of Key Constraints
In SQL Server, the main Foreign Key constraints will include the following:
Sessions.UserID
→ Users.UserID
Categories.ParentCategoryID
→ Categories.CategoryID
Products.CategoryID
→ Categories.CategoryID
Products.BrandID
→ Brands.BrandID
Searches.SessionID
→ Sessions.SessionID
SearchImpressions.SearchID
→ Searches.SearchID
SearchImpressions.ProductID
→ Products.ProductID
SearchClicks.SearchID
→ Searches.SearchID
SearchClicks.ProductID
→ Products.ProductID
ProductViews.SessionID
→ Sessions.SessionID
ProductViews.ProductID
→ Products.ProductID
ProductViews.SearchID
→ Searches.SearchID [NULL allowed]
CartEvents.SessionID
→ Sessions.SessionID
CartEvents.ProductID
→ Products.ProductID
CheckoutEvents.SessionID
→ Sessions.SessionID
Orders.UserID
→ Users.UserID
Orders.SessionID
→ Sessions.SessionID
OrderItems.OrderID
→ Orders.OrderID
OrderItems.ProductID
→ Products.ProductID
ExperimentVariants.ExperimentID
→ Experiments.ExperimentID
ExperimentAssignments.ExperimentID
→ Experiments.ExperimentID
ExperimentAssignments.VariantID
→ ExperimentVariants.VariantID
ExperimentAssignments.UserID
→ Users.UserID [NULL allowed]
ExperimentAssignments.SessionID
→ Sessions.SessionID [NULL allowed]
ER Diagram
The overall ERD structure will consist of three main sections:
Product Catalog:
Categories → Brands → Products
Customer Journey:
Users → Sessions → Searches → SearchImpressions / SearchClicks → ProductViews → CartEvents → CheckoutEvents → Orders → OrderItems
Experimentation:
Experiments → Experiment Variants → Experiment Assignments → Users / Sessions

Questions & Goals:
Business Goal
The primary goal of the ShopSense project is to understand how users move through the e-commerce customer journey, identify where friction or lost conversion occurs, and determine how improvements to product discovery and search experience can increase customer engagement, conversion, and revenue.
The project focuses on one central business question:
Why do some users demonstrate strong search and product engagement but fail to convert into customers?
To answer this question, the analysis connects customer, session, search, product interaction, cart, checkout, transaction, and experimentation data across the complete shopping journey.
1. Customer & Session Analysis
Questions:
How many users and sessions are generated over time?
What proportion of users are new versus returning customers?
Which acquisition sources generate the most users and sessions?
How does user behavior differ across Desktop, Mobile, and Tablet?
Which traffic sources generate the highest engagement?
How many sessions does an average user generate?
Which customer segments demonstrate the strongest engagement?
Do highly engaged users necessarily have higher conversion rates?
Which combinations of device, traffic source, and customer type are associated with unusually high or low conversion?
Goal:
Understand who the users are, how they reach ShopSense, and how their session behavior differs, creating the foundation for customer and behavioral segmentation.
2. Search & Product Discovery Analysis
Questions:
What percentage of sessions use search?
How many searches does an average search session contain?
Which search queries are most frequently used?
Which queries generate the highest and lowest engagement?
What percentage of searches return zero results?
Which queries have the highest Zero-Result Rate?
What is the overall Search Click-Through Rate (Search CTR)?
How does CTR change by search-result position?
Which products receive many impressions but relatively few clicks?
Do users who use filters behave differently from users who do not?
How do sorting options affect search engagement?
Which search queries generate strong engagement but weak purchasing outcomes?
Goal:
Evaluate the effectiveness of the ShopSense search and product discovery experience and identify situations where users show clear purchase intent but struggle to find or select suitable products.
3. Product Performance Analysis
Questions:
Which products receive the most impressions, clicks, and product views?
Which products generate the highest Add-to-Cart Rate?
Which products generate the highest conversion rate?
Which products receive high traffic but low conversion?
Which brands and categories generate the most revenue?
Does product rating appear to be associated with conversion?
How does product price or discount level relate to customer behavior?
Are some products frequently added to the cart but later removed?
Which categories have strong discovery performance but weak purchasing performance?
Goal:
Identify high-performing and underperforming products, brands, and categories and determine where product interest fails to translate into revenue.
4. Funnel & Drop-off Analysis
The core ShopSense funnel is:
Search → Product View → Add to Cart → Checkout → Purchase
Questions:
How many users or sessions reach each stage of the funnel?
What is the conversion rate between each stage?
At which stage does the largest drop-off occur?
How does funnel performance differ by device?
How does it differ between new and returning users?
How does funnel performance vary by acquisition source?
Which product categories experience the highest funnel abandonment?
How many users add products to their cart but never start checkout?
How many users start checkout but fail to complete a purchase?
At which checkout stage does the greatest abandonment occur?
Goal:
Identify the critical friction points in the customer journey and determine where ShopSense loses the greatest number of potential customers.
5. Conversion Analysis
Questions:
What is the overall purchase conversion rate?
What is the conversion rate for search sessions versus non-search sessions?
Do users who perform multiple searches convert differently from users who perform only one search?
Does higher Search CTR lead to higher purchase conversion?
Are there users with high search engagement but unexpectedly low conversion?
Which customer or session segments have the highest conversion loss?
Which devices, acquisition sources, categories, or search behaviors are associated with lower conversion?
Goal:
Determine which behaviors are most strongly associated with successful conversion and identify the segments responsible for significant lost purchase opportunities.
6. Revenue Analysis
Questions:
What is total revenue?
What is the Average Order Value (AOV)?
What is Revenue per User?
What is Revenue per Session?
What is Revenue per Search Session?
Which products, brands, and categories contribute the most revenue?
Which customer segments generate the highest revenue?
Which acquisition sources generate the strongest commercial outcomes?
Do high-engagement sessions generate proportionally higher revenue?
Which segments generate strong engagement but relatively weak revenue?
Goal:
Connect behavioral analytics with commercial outcomes so that recommendations are based not only on engagement but also on measurable business impact.
7. Customer & Behavioral Segmentation
Questions:
Can users or sessions be divided into meaningful behavioral groups such as:
High Engagement / High Conversion
High Engagement / Low Conversion
Low Engagement / High Conversion
Low Engagement / Low Conversion
Additional segmentation will examine:
Search Users vs. Non-Search Users
New vs. Returning Users
Device Type
Acquisition Source
Product Category
Purchase Behavior
Goal:
Identify customer segments with different behaviors and isolate the strategically important High-Engagement / Low-Conversion segment, where users demonstrate strong intent but encounter friction before purchase.
8. A/B Testing & Experimentation
Questions:
Does the Treatment experience improve Search CTR compared with Control?
Does it increase Add-to-Cart Rate?
Does it improve Search-to-Purchase Conversion Rate?
Does it increase Revenue per Session?
What is the absolute and relative uplift between Control and Treatment?
Are observed differences statistically significant?
What are the confidence intervals around the estimated effect?
Does the Treatment improve the primary metric without negatively affecting important guardrail metrics?
Does the experiment affect customer segments differently?
Are improvements in engagement accompanied by improvements in actual purchases and revenue?
Goal:
Determine whether proposed product-discovery improvements produce measurable and statistically supported changes in customer behavior and business outcomes.
9. Final Business Questions
At the end of the project, the analysis should provide evidence to answer five broader questions:
1. Where is ShopSense losing potential customers?
2. Which users demonstrate purchase intent but fail to convert?
3. What search, product, device, or customer characteristics are associated with that friction?
4. What product or customer-experience improvements could address the identified problems?
5. Do controlled experiments provide evidence that the proposed changes improve conversion and business outcomes?
Final Project Goal:
The final goal of ShopSense is not simply to create reports and dashboards, but to demonstrate an end-to-end product analytics process:
Business Question → Data Model → SQL Analysis → Behavioral Investigation → Funnel Analysis → Segmentation → Hypothesis → Experiment → Statistical Evaluation → Business Recommendation
The project should ultimately demonstrate how customer behavior data can be transformed into actionable product insights and evidence-based business decisions.
Steps:
The table creation order is important because of the Foreign Key dependencies:
Users, Categories, Brands, Experiments
Sessions, Products, ExperimentVariants
Searches, ProductViews, CartEvents, CheckoutEvents, Orders, ExperimentAssignments
SearchImpressions, SearchClicks, OrderItems
1. Create the Database
First, we create the database itself:
CREATE DATABASE ShopSense;
GO
USE ShopSense;
GO
Users Table:
CREATE TABLE Users
(
UserID INT IDENTITY(1,1) PRIMARY KEY,
RegistrationDate DATE NOT NULL,
CustomerType VARCHAR(20) NOT NULL,
AgeGroup VARCHAR(20) NULL,
Country VARCHAR(50) NULL,
Region VARCHAR(50) NULL,
AcquisitionSource VARCHAR(50) NULL,
IsRegistered BIT NOT NULL
CONSTRAINT DF_Users_IsRegistered DEFAULT 1,
IsActive BIT NOT NULL
CONSTRAINT DF_Users_IsActive DEFAULT 1,
CONSTRAINT CK_Users_CustomerType
CHECK (CustomerType IN (‘New’, ‘Returning’))
);
GO
SELECT *
FROM Users;
EXEC sp_help ‘Users’;
USE ShopSense;
GO
Categories Table:
CREATE TABLE Categories
(
CategoryID INT IDENTITY(1,1) NOT NULL,
CategoryName VARCHAR(100) NOT NULL,
ParentCategoryID INT NULL,
IsActive BIT NOT NULL
CONSTRAINT DF_Categories_IsActive DEFAULT 1,
CONSTRAINT PK_Categories
PRIMARY KEY (CategoryID),
CONSTRAINT UQ_Categories_CategoryName
UNIQUE (CategoryName),
CONSTRAINT FK_Categories_ParentCategory
FOREIGN KEY (ParentCategoryID)
REFERENCES Categories(CategoryID)
);
GO
Brands Table:
CREATE TABLE Brands
(
BrandID INT IDENTITY(1,1) NOT NULL,
BrandName VARCHAR(100) NOT NULL,
CountryOfOrigin VARCHAR(50) NULL,
IsActive BIT NOT NULL
CONSTRAINT DF_Brands_IsActive DEFAULT 1,
CONSTRAINT PK_Brands
PRIMARY KEY (BrandID),
CONSTRAINT UQ_Brands_BrandName
UNIQUE (BrandName)
);
GO
Experiments Table:
CREATE TABLE Experiments
(
ExperimentID INT IDENTITY(1,1) NOT NULL,
ExperimentName VARCHAR(150) NOT NULL,
Description VARCHAR(500) NULL,
StartDate DATE NOT NULL,
EndDate DATE NULL,
PrimaryMetric VARCHAR(100) NOT NULL,
Status VARCHAR(20) NOT NULL,
CONSTRAINT PK_Experiments
PRIMARY KEY (ExperimentID),
CONSTRAINT UQ_Experiments_ExperimentName
UNIQUE (ExperimentName),
CONSTRAINT CK_Experiments_Status
CHECK (Status IN (‘Planned’, ‘Running’, ‘Completed’, ‘Cancelled’)),
CONSTRAINT CK_Experiments_DateRange
CHECK (EndDate IS NULL OR EndDate >= StartDate)
);
GO
Sessions Table
This table records each user visit to ShopSense and is directly connected to the Users table.
USE ShopSense;
GO
USE ShopSense;
GO
CREATE TABLE Sessions
(
SessionID BIGINT IDENTITY(1,1) NOT NULL,
UserID INT NOT NULL,
SessionStart DATETIME2 NOT NULL,
SessionEnd DATETIME2 NULL,
DeviceType VARCHAR(20) NOT NULL,
TrafficSource VARCHAR(50) NOT NULL,
Campaign VARCHAR(100) NULL,
LandingPage VARCHAR(100) NULL,
Browser VARCHAR(30) NULL,
SessionDurationSeconds INT NULL,
CONSTRAINT PK_Sessions
PRIMARY KEY (SessionID),
CONSTRAINT FK_Sessions_Users
FOREIGN KEY (UserID)
REFERENCES Users(UserID),
CONSTRAINT CK_Sessions_DeviceType
CHECK (DeviceType IN (‘Desktop’, ‘Mobile’, ‘Tablet’)),
CONSTRAINT CK_Sessions_TrafficSource
CHECK (TrafficSource IN
(‘Organic’, ‘Paid’, ‘Direct’, ‘Social’, ‘Email’)),
CONSTRAINT CK_Sessions_Duration
CHECK (SessionDurationSeconds IS NULL
OR SessionDurationSeconds >= 0),
CONSTRAINT CK_Sessions_TimeRange
CHECK (SessionEnd IS NULL
OR SessionEnd >= SessionStart)
);
GO
The relationship we created is:
Users
1
│
│
N
Sessions
Sessions.UserID
↓
Users.UserID
Two constraints are also used to prevent invalid data. For example, a Session cannot end before it starts, and its Duration cannot be negative.
Products Table
This table is connected to both parent tables: Categories and Brands.
CREATE TABLE Products
(
ProductID INT IDENTITY(1,1) NOT NULL,
ProductName VARCHAR(150) NOT NULL,
CategoryID INT NOT NULL,
BrandID INT NOT NULL,
ListPrice DECIMAL(10,2) NOT NULL,
DiscountPercent DECIMAL(5,2) NOT NULL
CONSTRAINT DF_Products_DiscountPercent DEFAULT 0,
Rating DECIMAL(3,2) NULL,
ReviewCount INT NOT NULL
CONSTRAINT DF_Products_ReviewCount DEFAULT 0,
StockQuantity INT NOT NULL
CONSTRAINT DF_Products_StockQuantity DEFAULT 0,
IsActive BIT NOT NULL
CONSTRAINT DF_Products_IsActive DEFAULT 1,
CreatedDate DATE NOT NULL,
CONSTRAINT PK_Products
PRIMARY KEY (ProductID),
CONSTRAINT FK_Products_Categories
FOREIGN KEY (CategoryID)
REFERENCES Categories(CategoryID),
CONSTRAINT FK_Products_Brands
FOREIGN KEY (BrandID)
REFERENCES Brands(BrandID),
CONSTRAINT CK_Products_ListPrice
CHECK (ListPrice >= 0),
CONSTRAINT CK_Products_DiscountPercent
CHECK (DiscountPercent BETWEEN 0 AND 100),
CONSTRAINT CK_Products_Rating
CHECK (Rating IS NULL OR Rating BETWEEN 0 AND 5),
CONSTRAINT CK_Products_ReviewCount
CHECK (ReviewCount >= 0),
CONSTRAINT CK_Products_StockQuantity
CHECK (StockQuantity >= 0)
);
GO
Categories (1) ─────< Products
Brands (1) ─────< Products
ExperimentVariants Table:
This table stores the different variants of each A/B test.
CREATE TABLE ExperimentVariants
(
VariantID INT IDENTITY(1,1) NOT NULL,
ExperimentID INT NOT NULL,
VariantName VARCHAR(50) NOT NULL,
VariantDescription VARCHAR(300) NULL,
AllocationPercent DECIMAL(5,2) NOT NULL,
CONSTRAINT PK_ExperimentVariants
PRIMARY KEY (VariantID),
CONSTRAINT FK_ExperimentVariants_Experiments
FOREIGN KEY (ExperimentID)
REFERENCES Experiments(ExperimentID),
CONSTRAINT CK_ExperimentVariants_AllocationPercent
CHECK (AllocationPercent > 0
AND AllocationPercent <= 100),
CONSTRAINT UQ_ExperimentVariants_Experiment_Variant
UNIQUE (ExperimentID, VariantName)
);
GO
Experiments
1
│
│
N
ExperimentVariants
Verify Table Creation
SELECT
TABLE_NAME
FROM INFORMATION_SCHEMA.TABLES
WHERE TABLE_TYPE = ‘BASE TABLE’
ORDER BY TABLE_NAME;
GO

Verify Foreign Key
SELECT
fk.name AS ForeignKey,
OBJECT_NAME(fk.parent_object_id) AS ChildTable,
COL_NAME(fkc.parent_object_id,
fkc.parent_column_id) AS ChildColumn,
OBJECT_NAME(fk.referenced_object_id) AS ParentTable,
COL_NAME(fkc.referenced_object_id,
fkc.referenced_column_id) AS ParentColumn
FROM sys.foreign_keys fk
INNER JOIN sys.foreign_key_columns fkc
ON fk.object_id = fkc.constraint_object_id
ORDER BY ChildTable, ForeignKey;

Searches Table
This table stores each search query performed by a user during a Session.
USE ShopSense;
GO
CREATE TABLE Searches
(
SearchID BIGINT IDENTITY(1,1) NOT NULL,
SessionID BIGINT NOT NULL,
SearchQuery VARCHAR(255) NOT NULL,
SearchTimestamp DATETIME2 NOT NULL,
ResultsCount INT NOT NULL,
SearchType VARCHAR(30) NOT NULL,
FiltersApplied BIT NOT NULL
CONSTRAINT DF_Searches_FiltersApplied DEFAULT 0,
SortOption VARCHAR(30) NULL,
CONSTRAINT PK_Searches
PRIMARY KEY (SearchID),
CONSTRAINT FK_Searches_Sessions
FOREIGN KEY (SessionID)
REFERENCES Sessions(SessionID),
CONSTRAINT CK_Searches_ResultsCount
CHECK (ResultsCount >= 0),
CONSTRAINT CK_Searches_SearchType
CHECK (SearchType IN
(‘Keyword’, ‘Category’, ‘Suggested’)),
CONSTRAINT CK_Searches_SortOption
CHECK (
SortOption IS NULL
OR SortOption IN
(‘Relevance’, ‘PriceLowHigh’,
‘PriceHighLow’, ‘Rating’)
)
);
GO
Sessions (1) ─────< Searches (N)
ProductViews Table
This table records each Product Page View.
CREATE TABLE ProductViews
(
ProductViewID BIGINT IDENTITY(1,1) NOT NULL,
SessionID BIGINT NOT NULL,
ProductID INT NOT NULL,
SearchID BIGINT NULL,
ViewTimestamp DATETIME2 NOT NULL,
ViewDurationSeconds INT NULL,
SourcePage VARCHAR(50) NOT NULL,
CONSTRAINT PK_ProductViews
PRIMARY KEY (ProductViewID),
CONSTRAINT FK_ProductViews_Sessions
FOREIGN KEY (SessionID)
REFERENCES Sessions(SessionID),
CONSTRAINT FK_ProductViews_Products
FOREIGN KEY (ProductID)
REFERENCES Products(ProductID),
CONSTRAINT FK_ProductViews_Searches
FOREIGN KEY (SearchID)
REFERENCES Searches(SearchID),
CONSTRAINT CK_ProductViews_Duration
CHECK (
ViewDurationSeconds IS NULL
OR ViewDurationSeconds >= 0
),
CONSTRAINT CK_ProductViews_SourcePage
CHECK (
SourcePage IN
(‘Search’, ‘Home’, ‘Category’,
‘Recommendation’, ‘Promotion’)
)
);
GO
Relationship:
Sessions ─────< ProductViews
Products ─────< ProductViews
Searches ─────< ProductViews
CartEvents Table
In ShopSense, the shopping cart is designed using an Event-Based approach.
CREATE TABLE CartEvents
(
CartEventID BIGINT IDENTITY(1,1) NOT NULL,
SessionID BIGINT NOT NULL,
ProductID INT NOT NULL,
EventType VARCHAR(20) NOT NULL,
Quantity INT NOT NULL,
UnitPrice DECIMAL(10,2) NOT NULL,
EventTimestamp DATETIME2 NOT NULL,
CONSTRAINT PK_CartEvents
PRIMARY KEY (CartEventID),
CONSTRAINT FK_CartEvents_Sessions
FOREIGN KEY (SessionID)
REFERENCES Sessions(SessionID),
CONSTRAINT FK_CartEvents_Products
FOREIGN KEY (ProductID)
REFERENCES Products(ProductID),
CONSTRAINT CK_CartEvents_EventType
CHECK (
EventType IN
(‘Add’, ‘Remove’, ‘QuantityChange’)
),
CONSTRAINT CK_CartEvents_Quantity
CHECK (Quantity > 0),
CONSTRAINT CK_CartEvents_UnitPrice
CHECK (UnitPrice >= 0)
);
GO
CheckoutEvents Table
CREATE TABLE CheckoutEvents
(
CheckoutEventID BIGINT IDENTITY(1,1) NOT NULL,
SessionID BIGINT NOT NULL,
EventType VARCHAR(30) NOT NULL,
EventTimestamp DATETIME2 NOT NULL,
PaymentMethod VARCHAR(30) NULL,
ShippingMethod VARCHAR(30) NULL,
CONSTRAINT PK_CheckoutEvents
PRIMARY KEY (CheckoutEventID),
CONSTRAINT FK_CheckoutEvents_Sessions
FOREIGN KEY (SessionID)
REFERENCES Sessions(SessionID),
CONSTRAINT CK_CheckoutEvents_EventType
CHECK (
EventType IN
(‘Started’, ‘Shipping’,
‘Payment’, ‘Completed’)
),
CONSTRAINT CK_CheckoutEvents_PaymentMethod
CHECK (
PaymentMethod IS NULL
OR PaymentMethod IN
(‘CreditCard’, ‘DebitCard’,
‘PayPal’, ‘DigitalWallet’)
),
CONSTRAINT CK_CheckoutEvents_ShippingMethod
CHECK (
ShippingMethod IS NULL
OR ShippingMethod IN
(‘Standard’, ‘Express’, ‘Pickup’)
)
);
GO
Therefore, we can also analyze the internal Checkout Funnel:
Started
↓
Shipping
↓
Payment
↓
Completed
For example, if a Session reaches the Payment stage but does not reach Completed, it indicates a Checkout Drop-off.
Orders Table
CREATE TABLE Orders
(
OrderID BIGINT IDENTITY(1,1) NOT NULL,
UserID INT NOT NULL,
SessionID BIGINT NOT NULL,
OrderDate DATETIME2 NOT NULL,
OrderStatus VARCHAR(30) NOT NULL,
Subtotal DECIMAL(12,2) NOT NULL,
DiscountAmount DECIMAL(10,2) NOT NULL
CONSTRAINT DF_Orders_DiscountAmount DEFAULT 0,
ShippingAmount DECIMAL(10,2) NOT NULL
CONSTRAINT DF_Orders_ShippingAmount DEFAULT 0,
TaxAmount DECIMAL(10,2) NOT NULL
CONSTRAINT DF_Orders_TaxAmount DEFAULT 0,
TotalAmount DECIMAL(12,2) NOT NULL,
CONSTRAINT PK_Orders
PRIMARY KEY (OrderID),
CONSTRAINT FK_Orders_Users
FOREIGN KEY (UserID)
REFERENCES Users(UserID),
CONSTRAINT FK_Orders_Sessions
FOREIGN KEY (SessionID)
REFERENCES Sessions(SessionID),
CONSTRAINT CK_Orders_Status
CHECK (
OrderStatus IN
(‘Completed’, ‘Cancelled’, ‘Refunded’)
),
CONSTRAINT CK_Orders_Subtotal
CHECK (Subtotal >= 0),
CONSTRAINT CK_Orders_DiscountAmount
CHECK (DiscountAmount >= 0),
CONSTRAINT CK_Orders_ShippingAmount
CHECK (ShippingAmount >= 0),
CONSTRAINT CK_Orders_TaxAmount
CHECK (TaxAmount >= 0),
CONSTRAINT CK_Orders_TotalAmount
CHECK (TotalAmount >= 0)
);
GO
This table has two important relationships:
Users (1) ─────< Orders
Sessions (1) ─────< Orders
This structure allows us to analyze Revenue and Conversion at both the Customer and Session levels.
ExperimentAssignments Table
This is one of the most important tables in ShopSense, as it connects user behavior to A/B Tests.
CREATE TABLE ExperimentAssignments
(
AssignmentID BIGINT IDENTITY(1,1) NOT NULL,
ExperimentID INT NOT NULL,
VariantID INT NOT NULL,
UserID INT NULL,
SessionID BIGINT NULL,
AssignmentTimestamp DATETIME2 NOT NULL,
CONSTRAINT PK_ExperimentAssignments
PRIMARY KEY (AssignmentID),
CONSTRAINT FK_ExperimentAssignments_Experiments
FOREIGN KEY (ExperimentID)
REFERENCES Experiments(ExperimentID),
CONSTRAINT FK_ExperimentAssignments_Variants
FOREIGN KEY (VariantID)
REFERENCES ExperimentVariants(VariantID),
CONSTRAINT FK_ExperimentAssignments_Users
FOREIGN KEY (UserID)
REFERENCES Users(UserID),
CONSTRAINT FK_ExperimentAssignments_Sessions
FOREIGN KEY (SessionID)
REFERENCES Sessions(SessionID),
CONSTRAINT CK_ExperimentAssignments_Target
CHECK (
(UserID IS NOT NULL AND SessionID IS NULL)
OR
(UserID IS NULL AND SessionID IS NOT NULL)
)
);
GO
Verify Table Creation
USE ShopSense;
GO
SELECT
TABLE_NAME
FROM INFORMATION_SCHEMA.TABLES
WHERE TABLE_TYPE = ‘BASE TABLE’
ORDER BY TABLE_NAME;
GO

SearchImpressions Table
Each time a product is displayed to a user in the search results, we create a Product Impression.
CREATE TABLE SearchImpressions
(
ImpressionID BIGINT IDENTITY(1,1) NOT NULL,
SearchID BIGINT NOT NULL,
ProductID INT NOT NULL,
ResultPosition INT NOT NULL,
ImpressionTimestamp DATETIME2 NOT NULL,
CONSTRAINT PK_SearchImpressions
PRIMARY KEY (ImpressionID),
CONSTRAINT FK_SearchImpressions_Searches
FOREIGN KEY (SearchID)
REFERENCES Searches(SearchID),
CONSTRAINT FK_SearchImpressions_Products
FOREIGN KEY (ProductID)
REFERENCES Products(ProductID),
CONSTRAINT CK_SearchImpressions_ResultPosition
CHECK (ResultPosition > 0)
);
GO
Searches (1) ─────< SearchImpressions >───── (1) Products
SearchClicks Table
Now, we record each click on a Search Impression.
CREATE TABLE SearchClicks
(
ClickID BIGINT IDENTITY(1,1) NOT NULL,
ImpressionID BIGINT NOT NULL,
ClickTimestamp DATETIME2 NOT NULL,
CONSTRAINT PK_SearchClicks
PRIMARY KEY (ClickID),
CONSTRAINT FK_SearchClicks_Impressions
FOREIGN KEY (ImpressionID)
REFERENCES SearchImpressions(ImpressionID)
);
GO
Realationships:
SearchImpressions (1) ─────< SearchClicks (N)
In the current design, each Impression can have at most one Click. Therefore, it is better to enforce this rule at the database level as well.
To achieve this, we will add a Unique Constraint:
ALTER TABLE SearchClicks
ADD CONSTRAINT UQ_SearchClicks_Impression
UNIQUE (ImpressionID);
GO
OrderItems Table
Now we come to the very important Revenue section.
An Order can contain multiple Products, so Products and Orders have a conceptual Many-to-Many relationship, which is resolved through OrderItems:
Realationships:
Orders (1) ─────< OrderItems >───── (1) Products
CREATE TABLE OrderItems
(
OrderItemID BIGINT IDENTITY(1,1) NOT NULL,
OrderID BIGINT NOT NULL,
ProductID INT NOT NULL,
Quantity INT NOT NULL,
UnitPrice DECIMAL(10,2) NOT NULL,
DiscountAmount DECIMAL(10,2) NOT NULL
CONSTRAINT DF_OrderItems_DiscountAmount DEFAULT 0,
LineTotal AS
(
(Quantity * UnitPrice) – DiscountAmount
) PERSISTED,
CONSTRAINT PK_OrderItems
PRIMARY KEY (OrderItemID),
CONSTRAINT FK_OrderItems_Orders
FOREIGN KEY (OrderID)
REFERENCES Orders(OrderID),
CONSTRAINT FK_OrderItems_Products
FOREIGN KEY (ProductID)
REFERENCES Products(ProductID),
CONSTRAINT CK_OrderItems_Quantity
CHECK (Quantity > 0),
CONSTRAINT CK_OrderItems_UnitPrice
CHECK (UnitPrice >= 0),
CONSTRAINT CK_OrderItems_DiscountAmount
CHECK (
DiscountAmount >= 0
AND DiscountAmount <= (Quantity * UnitPrice)
)
);
GO
Search Structure
Searches
│
│ 1:N
▼
SearchImpressions
│
│ 1:N
▼
SearchClicks
SearchImpressions
│
│ N:1
▼
Products
Revenue Structure
Orders
│
│ 1:N
▼
OrderItems
│
│ N:1
▼
Products
Database Validation
USE ShopSense;
GO
SELECT
TABLE_NAME
FROM INFORMATION_SCHEMA.TABLES
WHERE TABLE_TYPE = ‘BASE TABLE’
ORDER BY TABLE_NAME;
GO

USE ShopSense;
GO
SELECT DB_NAME() AS CurrentDatabase;
GO
SELECT COUNT(*) AS TotalTables
FROM INFORMATION_SCHEMA.TABLES
WHERE TABLE_TYPE = ‘BASE TABLE’;
GO

Primary Key
SELECT
t.name AS TableName,
kc.name AS PrimaryKeyName,
c.name AS PrimaryKeyColumn
FROM sys.tables t
INNER JOIN sys.key_constraints kc
ON t.object_id = kc.parent_object_id
INNER JOIN sys.index_columns ic
ON kc.parent_object_id = ic.object_id
AND kc.unique_index_id = ic.index_id
INNER JOIN sys.columns c
ON ic.object_id = c.object_id
AND ic.column_id = c.column_id
WHERE kc.type = ‘PK’
ORDER BY t.name;

Foreign Key
SELECT
fk.name AS ForeignKeyName,
OBJECT_NAME(fk.parent_object_id) AS ChildTable,
COL_NAME(
fkc.parent_object_id,
fkc.parent_column_id
) AS ChildColumn,
OBJECT_NAME(fk.referenced_object_id) AS ParentTable,
COL_NAME(
fkc.referenced_object_id,
fkc.referenced_column_id
) AS ParentColumn
FROM sys.foreign_keys fk
INNER JOIN sys.foreign_key_columns fkc
ON fk.object_id = fkc.constraint_object_id
ORDER BY ChildTable, ForeignKeyName;

CHECK Constraints
SELECT
OBJECT_NAME(parent_object_id) AS TableName,
name AS ConstraintName,
definition AS ConstraintDefinition
FROM sys.check_constraints
ORDER BY TableName, ConstraintName;

Unique Constraints
SELECT
OBJECT_NAME(i.object_id) AS TableName,
i.name AS ConstraintName,
COL_NAME(ic.object_id, ic.column_id) AS ColumnName
FROM sys.indexes i
INNER JOIN sys.index_columns ic
ON i.object_id = ic.object_id
AND i.index_id = ic.index_id
WHERE i.is_unique = 1
AND i.is_primary_key = 0
ORDER BY TableName, ConstraintName;

Verify the Number of Columns in Each Table
SELECT
t.name AS TableName,
COUNT(c.column_id) AS NumberOfColumns
FROM sys.tables t
INNER JOIN sys.columns c
ON t.object_id = c.object_id
GROUP BY t.name
ORDER BY t.name;
However, we omitted it when creating the final table.
From an analytical perspective, this field is valuable because Sponsored Results can influence CTR and Search Ranking Performance.
USE ShopSense;
GO
ALTER TABLE SearchImpressions
ADD IsSponsored BIT NOT NULL
CONSTRAINT DF_SearchImpressions_IsSponsored DEFAULT 0;
GO
EXEC sp_help ‘SearchImpressions’;
GO
In the initial design, the SearchClicks table was intended to include the following fields:
SearchClickID
SearchID
ProductID
ClickTimestamp
ClickPosition
However, in the SQL implementation, we adopted a more normalized structure:
ClickID
ImpressionID
ClickTimestamp
Relationship:
SearchClicks
│
ImpressionID
↓
SearchImpressions
├── SearchID
├── ProductID
└── ResultPosition
Business Problems
Mobile Friction: Mobile users may show high levels of Search activity and Product Views, but experience greater drop-off at the Product View → Cart or Checkout → Purchase stages. This represents the type of High Engagement / Low Conversion behavior that directly supports ShopSense’s central analytical question.
Search Ranking Problem: Some products may receive a high number of Impressions, particularly in favorable ranking positions, but still generate a relatively low CTR. At the same time, higher-ranked search results are generally expected to achieve better CTR. This creates an opportunity to analyze Search Ranking Performance and identify products that underperform despite strong visibility.
Zero-Result Problem: Several Search Queries will intentionally generate a higher number of Zero-Result Searches. While the overall site-level Zero-Result Rate should remain realistic, certain queries will show unusually high rates, allowing us to identify problematic search terms.
Category/Product Friction: One or two Categories may demonstrate strong CTR and Product View activity but relatively low Add-to-Cart or Purchase rates. The analysis can then investigate whether factors such as Price, Rating, Discount, or other product characteristics are associated with this behavior.
Cart & Checkout Drop-off: Not every Add-to-Cart event will progress to Checkout, and not every Checkout will result in an Order. We will also create a more noticeable drop-off at one stage of the Checkout process so that the Funnel Analysis produces meaningful and interpretable results.
Search vs. Non-Search: Users who engage with Search will generally demonstrate higher Purchase Intent. However, one specific segment of Search Users will exhibit high engagement but relatively weak conversion. This directly connects to the central analytical question of the ShopSense project:
Why do some highly engaged search users fail to convert?
Data Dictionary
1. Users — Customer master data
| Column | Data Type | Key | Null | Description |
| —————– | ———– | — | —- | ———————————— |
| UserID | INT | PK | No | Unique customer identifier |
| RegistrationDate | DATE | — | No | Customer registration date |
| CustomerType | VARCHAR(20) | — | No | New or Returning customer |
| AgeGroup | VARCHAR(20) | — | Yes | Customer age segment |
| Country | VARCHAR(50) | — | Yes | Customer country |
| Region | VARCHAR(50) | — | Yes | Geographic region |
| AcquisitionSource | VARCHAR(50) | — | Yes | Original customer acquisition source |
| IsRegistered | BIT | — | No | Indicates registered customer |
| IsActive | BIT | — | No | Current customer status |
2. Sessions — Website/app visits
| Column | Data Type | Key | Null | Description |
| ———————- | ———— | — | —- | —————————– |
| SessionID | BIGINT | PK | No | Unique session identifier |
| UserID | INT | FK | No | User associated with session |
| SessionStart | DATETIME2 | — | No | Session start timestamp |
| SessionEnd | DATETIME2 | — | Yes | Session end timestamp |
| DeviceType | VARCHAR(20) | — | No | Desktop, Mobile or Tablet |
| TrafficSource | VARCHAR(50) | — | No | Source generating the session |
| Campaign | VARCHAR(100) | — | Yes | Marketing campaign |
| LandingPage | VARCHAR(100) | — | Yes | First page of session |
| Browser | VARCHAR(30) | — | Yes | Browser used |
| SessionDurationSeconds | INT | — | Yes | Session duration |
3. Categories — Product hierarchy
| Column | Data Type | Key | Null | Description |
|—|—|—|—|—|
| CategoryID | INT | PK | No | Unique category |
| CategoryName | VARCHAR(100) | Unique | No | Category name |
| ParentCategoryID | INT | FK | Yes | Parent category |
| IsActive | BIT | — | No | Category status |
ParentCategoryID → Categories.CategoryID creates the self-referencing hierarchy.
4. Brands
| Column | Data Type | Key | Null | Description |
|—|—|—|—|—|
| BrandID | INT | PK | No | Unique brand |
| BrandName | VARCHAR(100) | Unique | No | Brand name |
| CountryOfOrigin | VARCHAR(50) | — | Yes | Brand origin |
| IsActive | BIT | — | No | Brand status |
5. Products
| Column | Data Type | Key | Null | Description |
|—|—|—|—|—|
| ProductID | INT | PK | No | Unique product |
| ProductName | VARCHAR(150) | — | No | Product name |
| CategoryID | INT | FK | No | Product category |
| BrandID | INT | FK | No | Product brand |
| ListPrice | DECIMAL(10,2) | — | No | Base product price |
| DiscountPercent | DECIMAL(5,2) | — | No | Current discount percentage |
| Rating | DECIMAL(3,2) | — | Yes | Average product rating |
| ReviewCount | INT | — | No | Number of reviews |
| StockQuantity | INT | — | No | Available inventory |
| IsActive | BIT | — | No | Product availability |
| CreatedDate | DATE | — | No | Product creation/listing date |
6. Searches
| Column | Data Type | Key | Null | Description |
|—|—|—|—|—|
| SearchID | BIGINT | PK | No | Unique search |
| SessionID | BIGINT | FK | No | Session performing search |
| SearchQuery | VARCHAR(255) | — | No | Search term |
| SearchTimestamp | DATETIME2 | — | No | Search time |
| ResultsCount | INT | — | No | Number of returned results |
| SearchType | VARCHAR(30) | — | No | Keyword, Category or Suggested |
| FiltersApplied | BIT | — | No | Whether filters were used |
| SortOption | VARCHAR(30) | — | Yes | Selected sorting method |
7. SearchImpressions
| Column | Data Type | Key | Null | Description |
|—|—|—|—|—|
| ImpressionID | BIGINT | PK | No | Unique search-result impression |
| SearchID | BIGINT | FK | No | Associated search |
| ProductID | INT | FK | No | Displayed product |
| ResultPosition | INT | — | No | Product ranking position |
| ImpressionTimestamp | DATETIME2 | — | No | Impression timestamp |
8. SearchClicks
| Column | Data Type | Key | Null | Description |
|—|—|—|—|—|
| ClickID | BIGINT | PK | No | Unique search click |
| ImpressionID | BIGINT | FK / Unique | No | Impression clicked |
| ClickTimestamp | DATETIME2 | — | No | Click timestamp |
9. ProductViews
| Column | Data Type | Key | Null | Description |
|—|—|—|—|—|
| ProductViewID | BIGINT | PK | No | Unique product view |
| SessionID | BIGINT | FK | No | Associated session |
| ProductID | INT | FK | No | Viewed product |
| SearchID | BIGINT | FK | Yes | Search leading to view |
| ViewTimestamp | DATETIME2 | — | No | View timestamp |
| ViewDurationSeconds | INT | — | Yes | Time spent viewing |
| SourcePage | VARCHAR(50) | — | No | Search, Home, Category, Recommendation or
Promotion |Nullable SearchID allows us to distinguish search-driven and non-search product discovery.
10. CartEvents
| Column | Data Type | Key | Null | Description |
|—|—|—|—|—|
| CartEventID | BIGINT | PK | No | Unique cart event |
| SessionID | BIGINT | FK | No | Associated session |
| ProductID | INT | FK | No | Product affected |
| EventType | VARCHAR(20) | — | No | Add, Remove or QuantityChange |
| Quantity | INT | — | No | Product quantity |
| UnitPrice | DECIMAL(10,2) | — | No | Price at event time |
| EventTimestamp | DATETIME2 | — | No | Event timestamp |
11. CheckoutEvents
| Column | Data Type | Key | Null | Description |
|—|—|—|—|—|
| CheckoutEventID | BIGINT | PK | No | Unique checkout event |
| SessionID | BIGINT | FK | No | Associated session |
| EventType | VARCHAR(30) | — | No | Started, Shipping, Payment or Completed |
| EventTimestamp | DATETIME2 | — | No | Event timestamp |
| PaymentMethod | VARCHAR(30) | — | Yes | Payment method |
| ShippingMethod | VARCHAR(30) | — | Yes | Shipping option |
This allows analysis of:
Started → Shipping → Payment → Completed
12. Orders
| Column | Data Type | Key | Null | Description |
|—|—|—|—|—|
| OrderID | BIGINT | PK | No | Unique order |
| UserID | INT | FK | No | Purchasing customer |
| SessionID | BIGINT | FK | No | Converting session |
| OrderDate | DATETIME2 | — | No | Purchase timestamp |
| OrderStatus | VARCHAR(30) | — | No | Completed, Cancelled or Refunded |
| Subtotal | DECIMAL(12,2) | — | No | Pre-discount/order subtotal |
| DiscountAmount | DECIMAL(10,2) | — | No | Order discount |
| ShippingAmount | DECIMAL(10,2) | — | No | Shipping charge |
| TaxAmount | DECIMAL(10,2) | — | No | Tax |
| TotalAmount | DECIMAL(12,2) | — | No | Final order value |
13. OrderItems
| Column | Data Type | Key | Null | Description |
|—|—|—|—|—|
| OrderItemID | BIGINT | PK | No | Unique order line |
| OrderID | BIGINT | FK | No | Associated order |
| ProductID | INT | FK | No | Purchased product |
| Quantity | INT | — | No | Quantity purchased |
| UnitPrice | DECIMAL(10,2) | — | No | Purchase-time unit price |
| DiscountAmount | DECIMAL(10,2) | — | No | Line-level discount |
| LineTotal | Computed | — | No | `(Quantity × UnitPrice) − DiscountAmount` |
LineTotal is calculated by SQL Server rather than supplied by our CSV.
14. Experiments
| Column | Data Type | Key | Null | Description |
|—|—|—|—|—|
| ExperimentID | INT | PK | No | Unique experiment |
| ExperimentName | VARCHAR(150) | Unique | No | Experiment name |
| Description | VARCHAR(500) | — | Yes | Experiment description |
| StartDate | DATE | — | No | Experiment start |
| EndDate | DATE | — | Yes | Experiment end |
| PrimaryMetric | VARCHAR(100) | — | No | Primary success metric |
| Status | VARCHAR(20) | — | No | Planned, Running, Completed or Cancelled |
15. ExperimentVariants
| Column | Data Type | Key | Null | Description |
|—|—|—|—|—|
| VariantID | INT | PK | No | Unique variant |
| ExperimentID | INT | FK | No | Parent experiment |
| VariantName | VARCHAR(50) | — | No | Control/Treatment |
| VariantDescription | VARCHAR(300) | — | Yes | Variant description |
| AllocationPercent | DECIMAL(5,2) | — | No | Intended traffic allocation |
16. ExperimentAssignments
| Column | Data Type | Key | Null | Description |
|—|—|—|—|—|
| AssignmentID | BIGINT | PK | No | Unique assignment |
| ExperimentID | INT | FK | No | Experiment |
| VariantID | INT | FK | No | Assigned variant |
| UserID | INT | FK | Yes | User-level assignment |
| SessionID | BIGINT | FK | Yes | Session-level assignment |
| AssignmentTimestamp | DATETIME2 | — | No | Assignment time |
Our CHECK constraint requires exactly one of UserID or SessionID to be populated.
ShopSense — Dataset Generation Specification
E-commerce Product Analytics & Experimentation
Now we move on to one of the most important stages of the ShopSense project: developing a detailed Synthetic Data Generation Specification before generating the CSV files.
At this stage, we will define the number of records, user distribution, search behavior, conversion rates, hidden business problems, and A/B testing scenario.
The goal is to create data that is not merely random but realistically simulates the behavior of an e-commerce platform, incorporates meaningful behavioral patterns, and enables the discovery of underlying business problems through data analysis.
Core tables Target records
16 ~700K
Customers Time period
10,000 12 months
January 1 – December 31, 2025
All records are fictional and will be generated using Python with reproducible random seeds.
1. Number of Records per Table
In this version, we define the target record counts for each table as follows. The numbers specified for event tables are generation targets and may vary slightly in the final output.
Table Target records
Users 10,000
Sessions 40,000
Categories 25
Brands 40
Products 1,000
Searches 45,000
SearchImpressions 400,000
SearchClicks 80,000
ProductViews 100,000
CartEvents 30,000
CheckoutEvents 18,000
Orders 6,000
OrderItems 12,000
Experiments 3
ExperimentVariants 6
ExperimentAssignments 15,000

Target Record Counts for the Main Tables: Small reference tables are excluded from the chart.
The total target dataset size is approximately 757,000 records. To maintain data integrity, event counts must be derived from simulated user behavior rather than adding invalid records simply to reach predetermined targets.
2-User and Session Specifications

Proposed Distribution of 40,000 Sessions, Not 10,000 Users
Traffic source distribution
Organic 35%
Paid 25%
Direct 20%
Social 12%
Email 8%
Users will not have the same number of Sessions. Some users will visit only once, while loyal customers will have multiple Sessions throughout the year. In addition, Returning Users will have a higher average purchase probability.
To avoid temporal inconsistencies, we will generate CustomerType as a synthetic profile attribute, consistent with the current definition in the Users table. For a more accurate analysis of New vs. Returning Customers, we will determine customer status based on the chronological order of Sessions and purchase history.
3. Search and Product Discovery Design
Search behavior targets
Sessions using search Average searches per search session
65% ~1.7
Overall search CTR Zero-result rate
~20% ~7%
For Search Ranking, the probability of a click will depend on the product’s Ranking Position. The following table presents the target distribution for synthetic data generation, not actual analytical results.
Result position Target CTR
1 35%
2 28%
3 23%
4–5 18%
6–10 11%
11+ 5%
Click probability will also be influenced by product relevance to the search query, Rating, Price, and Sponsored status. This ensures that Ranking Position is not the sole factor determining whether a user clicks on a product.
Business problem 1
High impressions / Low CTR
Approximately 5–10% of products will be designated as having low attractiveness or poor search relevance. Despite appearing in favorable ranking positions, these products will exhibit a lower CTR.
This pattern can later be investigated through Ranking Performance Analysis.
4-Conversion Funnel Design
The project’s main Conversion Funnel will be measured at the Session level. Since not all users perform a search, we will define two distinct paths: the Search Funnel and the Overall Shopping Funnel.
Business problem 2
Mobile friction
The probability of converting a Product View into an Add-to-Cart event will be designed to be lower for Mobile users than for Desktop users. Additionally, a segment of Mobile users will abandon Checkout at the Payment stage.
At the same time, Mobile users may exhibit higher levels of Search activity and Product Views. Therefore, this conversion problem cannot be identified through Engagement metrics alone.
5. Product, Category, and Revenue Design
We will distribute 1,000 products across 25 categories and 40 brands. Categories will follow a hierarchical structure, while Price, Discount, Rating, and Stock Availability will influence purchasing behavior.
For Revenue, the initial target is 6,000 orders, with an average of two items per order. Each order’s total amount must be consistent with the sum of its OrderItems, order-level discounts, taxes, and shipping costs.
Business problem 3
Category friction
In one or two Categories, Product Views and Add-to-Cart rates will be relatively high, while Purchase Conversion will be lower. This discrepancy may be associated with Price, Discounts, Stock Availability, or Checkout Abandonment.
During the analysis, we will examine the statistical relationships between these factors. However, correlation alone does not establish causation.
6. A/B Testing Design
We will define three Experiments. The project’s primary experiment will focus on Personalized Search Ranking.
Personalized Search Ranking
User-level randomized experiment
Control Treatment
Existing ranking Personalized ranking
Display products using the current ranking algorithm. Rank products based on user behavior and preferences.
Allocation: 50% Allocation: 50%
Primary metric: Search-to-Purchase Conversion Rate
Secondary metrics: Search CTR، Add-to-Cart Rate و Revenue per Session
Guardrails: Zero-Result Rate و Checkout Abandonment
For synthetic data generation, we will design the Treatment effect on CTR to be more pronounced than its effect on Purchase Conversion. However, we will not predetermine the outcome of the statistical test; the results must emerge from the generated data and the subsequent statistical analysis.
The other two experiments will be Product Recommendation Layout and Checkout Simplification. Each experiment will have its own independent Control and Treatment groups.
Technical Consideration: In the primary experiment, each user will be assigned to only one Variant, and all their eligible Sessions will retain that same Variant. During data generation, we must ensure random assignment, respect the experiment start date, and prevent cross-group contamination.
7. Data Integrity and Quality Rules
This section is essential to ensuring the reliability of the generated dataset.
All Foreign Keys (FKs) must reference valid records, and every Event must occur within the time range of its associated Session.
SearchClicks must reference a valid, previously recorded Impression. Each Impression can have at most one Click.
For Product Views originating from Search, ProductViews.SearchID must reference a Search belonging to the same Session.
Orders.UserID must match the User who owns the Session referenced by Orders.SessionID.
Each assigned Variant must belong to its corresponding Experiment, and no User or Session may receive duplicate assignments within the same Experiment.
LineTotal in OrderItems is a computed column and must not be included in the input CSV file.
Two additional validation measures are required before data generation: adding a composite Unique Key to ExperimentVariants to ensure consistency between Experiments and Variants, and validating the relationships between Sessions, Searches, and Orders, since the existing Foreign Key constraints alone do not enforce all these business rules.
8. Expected Outputs from the Data Generation Stage
-Dataset deliverables
-16 CSV files, one per table
-Python data-generation script with fixed random seed
-Data validation and integrity report
-Dataset statistics and actual funnel metrics
-SQL Server import instructions
-Documented synthetic business scenarios
0 of 6 deliverables completed
-Complete the SearchImpressions Table
USE ShopSense;
GO
IF COL_LENGTH(‘dbo.SearchImpressions’, ‘IsSponsored’) IS NULL
BEGIN
ALTER TABLE dbo.SearchImpressions
ADD IsSponsored BIT NOT NULL
CONSTRAINT DF_SearchImpressions_IsSponsored
DEFAULT 0;
END;
GO
Ensuring Experiment–Variant Consistency
Important Improvement for A/B Testing
In the initial design, ExperimentID and VariantID each have a separate Foreign Key. However, these two Foreign Keys alone do not guarantee that the assigned Variant actually belongs to the specified Experiment.
For example, an Assignment associated with Experiment 1 must not be allowed to receive a Variant belonging to Experiment 3.
First, we create a Composite Unique Constraint on the ExperimentVariants table:
USE ShopSense;
GO
IF NOT EXISTS (
SELECT 1
FROM sys.key_constraints
WHERE name = ‘UQ_ExperimentVariants_ExperimentVariant’
AND parent_object_id = OBJECT_ID(‘dbo.ExperimentVariants’)
)
BEGIN
ALTER TABLE dbo.ExperimentVariants
ADD CONSTRAINT UQ_ExperimentVariants_ExperimentVariant
UNIQUE (ExperimentID, VariantID);
END;
GO
Next, we create a Composite Foreign Key in the ExperimentAssignments table:
IF NOT EXISTS (
SELECT 1
FROM sys.foreign_keys
WHERE name = ‘FK_Assignments_ExperimentVariant’
AND parent_object_id = OBJECT_ID(‘dbo.ExperimentAssignments’)
)
BEGIN
ALTER TABLE dbo.ExperimentAssignments
WITH CHECK
ADD CONSTRAINT FK_Assignments_ExperimentVariant
FOREIGN KEY (ExperimentID, VariantID)
REFERENCES dbo.ExperimentVariants
(ExperimentID, VariantID);
END;
GO
-Ensuring User–Session Consistency in Orders
Each Order is associated with a User and a Session. We must ensure that the User recorded in the Order is the same User who owns the associated Session.
To enforce this rule, we will first create a Composite Unique Constraint in the Sessions table, followed by a Composite Foreign Key in the Orders table
IF NOT EXISTS (
SELECT 1
FROM sys.key_constraints
WHERE name = ‘UQ_Sessions_SessionUser’
AND parent_object_id = OBJECT_ID(‘dbo.Sessions’)
)
BEGIN
ALTER TABLE dbo.Sessions
ADD CONSTRAINT UQ_Sessions_SessionUser
UNIQUE (SessionID, UserID);
END;
GO
IF NOT EXISTS (
SELECT 1
FROM sys.foreign_keys
WHERE name = ‘FK_Orders_SessionUser’
AND parent_object_id = OBJECT_ID(‘dbo.Orders’)
)
BEGIN
ALTER TABLE dbo.Orders
WITH CHECK
ADD CONSTRAINT FK_Orders_SessionUser
FOREIGN KEY (SessionID, UserID)
REFERENCES dbo.Sessions(SessionID, UserID);
END;
GO
This Constraint prevents an Order from being associated with a Session belonging to another User.
4. Ensuring ProductViews Reference a Search Within the Same Session
In the ProductViews table, the SearchID field is optional. However, when it contains a value, it must reference a Search belonging to the same Session.
First, we add a Composite Unique Constraint to the Searches table:
IF NOT EXISTS (
SELECT 1
FROM sys.key_constraints
WHERE name = ‘UQ_Searches_SearchSession’
AND parent_object_id = OBJECT_ID(‘dbo.Searches’)
)
BEGIN
ALTER TABLE dbo.Searches
ADD CONSTRAINT UQ_Searches_SearchSession
UNIQUE (SearchID, SessionID);
END;
GO
IF NOT EXISTS (
SELECT 1
FROM sys.foreign_keys
WHERE name = ‘FK_ProductViews_SearchSession’
AND parent_object_id = OBJECT_ID(‘dbo.ProductViews’)
)
BEGIN
ALTER TABLE dbo.ProductViews
WITH CHECK
ADD CONSTRAINT FK_ProductViews_SearchSession
FOREIGN KEY (SearchID, SessionID)
REFERENCES dbo.Searches(SearchID, SessionID);
END;
GO
This relationship is essential for analyzing the Search → Product View journey. If SearchID is NULL, the product may have been viewed through another entry point, such as the Homepage, Category Page, or Product Recommendations.
5. Preventing Duplicate Assignments in A/B Testing
In the current design, each Assignment contains exactly one of UserID or SessionID. Therefore, we will create two Filtered Unique Indexes to prevent duplicate assignments.
IF NOT EXISTS (
SELECT 1
FROM sys.indexes
WHERE name = ‘UX_Assignments_ExperimentUser’
AND object_id = OBJECT_ID(‘dbo.ExperimentAssignments’)
)
BEGIN
CREATE UNIQUE INDEX UX_Assignments_ExperimentUser
ON dbo.ExperimentAssignments(ExperimentID, UserID)
WHERE UserID IS NOT NULL;
END;
GO
IF NOT EXISTS (
SELECT 1
FROM sys.indexes
WHERE name = ‘UX_Assignments_ExperimentSession’
AND object_id = OBJECT_ID(‘dbo.ExperimentAssignments’)
)
BEGIN
CREATE UNIQUE INDEX UX_Assignments_ExperimentSession
ON dbo.ExperimentAssignments(ExperimentID, SessionID)
WHERE SessionID IS NOT NULL;
END;
GO
This ensures that a User cannot be assigned more than once within the same Experiment, while still allowing them to participate in multiple experiments.
Dataset Generation Consideration
These indexes prevent duplicate assignments. However, random assignment, experiment start dates, and consistent Variant assignment across subsequent Sessions must be controlled in the Python data generation script.
6. Final Constraint Validation
USE ShopSense;
GO
SELECT
t.name AS TableName,
fk.name AS ForeignKeyName,
fk.is_disabled AS IsDisabled,
fk.is_not_trusted AS IsNotTrusted
FROM sys.foreign_keys fk
JOIN sys.tables t
ON fk.parent_object_id = t.object_id
ORDER BY t.name, fk.name;
GO

Final Schema Checklist
IsSponsored exists in the SearchImpressions table.
ExperimentID and VariantID are consistent.
The UserID associated with each Order matches the owner of its Session.
ProductViews references a Search belonging to the same Session.
Duplicate User or Session assignments within the same Experiment are prohibited.
All new Foreign Keys are enabled and trusted.
0 of 6 checks verified.
File Preparation
USE ShopSense;
GO
SELECT
t.name AS TableName,
SUM(p.rows) AS [RowCount]
FROM sys.tables AS t
INNER JOIN sys.partitions AS p
ON t.object_id = p.object_id
WHERE p.index_id IN (0, 1)
GROUP BY t.name
ORDER BY t.name;
GO

Import
We will import the files in the following order:
1. Parent tables
Users.csv
Categories.csv
Brands.csv
Experiments.csv
2. First-level child tables
Products.csv
Sessions.csv
ExperimentVariants.csv
3. Search and experimentation
Searches.csv
ExperimentAssignments.csv
4. Customer journey
SearchImpressions.csv
SearchClicks.csv
ProductViews.csv
CartEvents.csv
CheckoutEvents.csv
5. Transactions
Orders.csv
OrderItems.csv
0 of 16 tables imported
To import the CSV files into the 16 database tables, I will run Python from Command Prompt and execute the following commands:
cd /d C:\ShopSense
python import_shopsense_to_sqlserver.py


USE ShopSense;
GO
SELECT
t.name AS TableName,
SUM(p.rows) AS TotalRows
FROM sys.tables AS t
JOIN sys.partitions AS p
ON t.object_id = p.object_id
WHERE p.index_id IN (0, 1)
GROUP BY t.name
ORDER BY t.name;
Final Dataset Validation
1-Verify the Record Count of Each Table
USE ShopSense;
GO
SELECT
t.name AS TableName,
SUM(p.rows) AS TotalRows
FROM sys.tables AS t
JOIN sys.partitions AS p
ON t.object_id = p.object_id
WHERE p.index_id IN (0, 1)
GROUP BY t.name
ORDER BY t.name;

2. Verify the Record Counts of All Tables
USE ShopSense;
GO
WITH ExpectedCounts AS
(
SELECT *
FROM (VALUES
(‘Users’, 10000),
(‘Categories’, 25),
(‘Brands’, 40),
(‘Experiments’, 3),
(‘Products’, 1000),
(‘Sessions’, 40000),
(‘ExperimentVariants’, 6),
(‘Searches’, 45000),
(‘ExperimentAssignments’, 15000),
(‘SearchImpressions’, 400000),
(‘SearchClicks’, 80000),
(‘ProductViews’, 100000),
(‘CartEvents’, 30000),
(‘CheckoutEvents’, 27950),
(‘Orders’, 6000),
(‘OrderItems’, 12000)
) AS v(TableName, ExpectedRows)
),
ActualCounts AS
(
SELECT
t.name AS TableName,
SUM(p.rows) AS ActualRows
FROM sys.tables AS t
JOIN sys.partitions AS p
ON t.object_id = p.object_id
WHERE p.index_id IN (0, 1)
GROUP BY t.name
)
SELECT
e.TableName,
e.ExpectedRows,
ISNULL(a.ActualRows, 0) AS ActualRows,
CASE
WHEN e.ExpectedRows = a.ActualRows
THEN ‘PASS’
ELSE ‘FAIL’
END AS ValidationStatus
FROM ExpectedCounts AS e
LEFT JOIN ActualCounts AS a
ON e.TableName = a.TableName
ORDER BY e.TableName;

3. Verify Foreign Keys & Constraints
USE ShopSense;
GO
DBCC CHECKCONSTRAINTS WITH ALL_CONSTRAINTS;
We now move on to the next stage: SQL Exploratory Data Analysis (EDA). The objective is to understand the actual dataset structure, user behavior, and initial business patterns before conducting Sales Funnel Analysis and A/B Testing.
Phase 1: Initial Data Exploration Using SQL
We will begin with five fundamental analyses:
1. User Distribution: Analyze users by Customer Type, Country, and Acquisition Source.
2. Session Analysis: Examine the number of Sessions, average Session Duration, and Device Distribution.
3. Search Behavior: Analyze the number of Searches, Zero-Result Rate, and Filter Usage Patterns.
4. Order and Revenue Analysis: Calculate the total number of Orders, Total Revenue, and Average Order Value (AOV).
5. Data Time Range Validation: Examine the dataset’s date and time ranges to ensure consistency across events.
1- Customer Overview
USE ShopSense;
GO
— 1. Customer distribution
SELECT
CustomerType,
COUNT(*) AS TotalUsers,
CAST(
100.0 * COUNT(*) / SUM(COUNT(*)) OVER ()
AS DECIMAL(5,2)
) AS UserPercentage
FROM dbo.Users
GROUP BY CustomerType
ORDER BY TotalUsers DESC;
— 2. Users by country
SELECT
Country,
COUNT(*) AS TotalUsers
FROM dbo.Users
GROUP BY Country
ORDER BY TotalUsers DESC;
— 3. Acquisition channels
SELECT
AcquisitionSource,
COUNT(*) AS TotalUsers,
CAST(
100.0 * COUNT(*) / SUM(COUNT(*)) OVER ()
AS DECIMAL(5,2)
) AS UserPercentage
FROM dbo.Users
GROUP BY AcquisitionSource
ORDER BY TotalUsers DESC;

2 Session Overview
USE ShopSense;
GO
SELECT
DeviceType,
COUNT(*) AS TotalSessions,
CAST(
AVG(CAST(SessionDurationSeconds AS FLOAT))
AS DECIMAL(10,2)
) AS AvgDurationSeconds,
CAST(
100.0 * COUNT(*) / SUM(COUNT(*)) OVER ()
AS DECIMAL(5,2)
) AS SessionPercentage
FROM dbo.Sessions
GROUP BY DeviceType
ORDER BY TotalSessions DESC;

This analysis is essential to ShopSense’s central research question: Do Mobile users exhibit different engagement patterns compared to Desktop users?
3 Search Overview
USE ShopSense;
GO
SELECT
COUNT(*) AS TotalSearches,
SUM(CASE WHEN ResultsCount = 0 THEN 1 ELSE 0 END)
AS ZeroResultSearches,
CAST(
100.0 * SUM(CASE WHEN ResultsCount = 0 THEN 1 ELSE 0 END)
/ NULLIF(COUNT(*), 0)
AS DECIMAL(5,2)
) AS ZeroResultRate,
SUM(CASE WHEN FiltersApplied = 1 THEN 1 ELSE 0 END)
AS FilteredSearches
FROM dbo.Searches;

This query calculates the first Search Performance KPI: the Zero-Result Rate.
4. Revenue Overview
USE ShopSense;
GO
SELECT
COUNT(*) AS TotalOrders,
CAST(SUM(TotalAmount) AS DECIMAL(18,2))
AS TotalOrderValue,
CAST(AVG(TotalAmount) AS DECIMAL(18,2))
AS AverageOrderValue
FROM dbo.Orders;

At this stage, we examine the total value of all orders. To calculate actual revenue, we will later exclude or separately account for canceled and refunded orders based on OrderStatus.
5. Verify the Data Time Range
USE ShopSense;
GO
SELECT
MIN(SessionStart) AS FirstSession,
MAX(SessionStart) AS LastSession
FROM dbo.Sessions;
SELECT
MIN(OrderDate) AS FirstOrder,
MAX(OrderDate) AS LastOrder
FROM dbo.Orders;

At this stage, an interesting pattern emerges: approximately 55% of Sessions originate from Mobile users, yet their average Session Duration is not significantly different from that of Desktop users.
To determine whether Mobile users encounter friction in the later stages of the Conversion Funnel, we need to compare their behavior across the Search, Product View, and Purchase stages.
Analysis:
Step 1-Results of SQL Exploratory Data Analysis
1.1 Customer Overview
Approximately 62% of users are classified as Returning Customers. This variable provides a valuable opportunity to analyze behavioral differences between New and Returning Customers. However, to calculate the actual Customer Return Rate, we must also examine users’ Session and Order histories.
1.2 Session Overview
The average Session Duration is very similar across all three device types. Therefore, at this stage, there is no evidence of a substantial difference in time spent on the platform. However, Session Duration alone is not a sufficient indicator of engagement quality or purchase likelihood.
1.3. Search Overview
Seven out of every 100 searches return no results, indicating an overall Zero-Result Rate of 7%. In the next stages, we will investigate which Search Queries, Categories, and Device Types contribute most to these unsuccessful searches and whether they are associated with lower Purchase Conversion Rates.
1.4 Revenue Overview
These figures represent the total recorded value of all orders, not necessarily realized revenue. To calculate the final Revenue and Average Order Value (AOV), we must examine the status of canceled and refunded orders.
1.5 Data Time Range
Both datasets cover the 2025 calendar year. However, this check only confirms the overall data time range; the chronological sequence of each Order relative to its associated Session must be validated separately.

Step 2— Analyzing Behavioral Differences Between Mobile and Desktop Users
We now examine the first major analytical question of the project: Does the high share of Mobile users in Sessions translate into a similar share of Purchases?
The following query calculates the number of Sessions, Sessions with Search activity, Sessions with Orders, and Conversion Rate for each device type.
We use COUNT(DISTINCT …) to ensure that multiple Searches or multiple Orders within the same Session do not result in duplicate counting.
USE ShopSense;
GO
WITH SearchSessions AS
(
SELECT DISTINCT SessionID
FROM dbo.Searches
),
OrderSessions AS
(
SELECT DISTINCT SessionID
FROM dbo.Orders
)
SELECT
s.DeviceType,
COUNT(*) AS TotalSessions,
COUNT(ss.SessionID) AS SearchSessions,
COUNT(os.SessionID) AS PurchasingSessions,
CAST(
100.0 * COUNT(ss.SessionID)
/ NULLIF(COUNT(*), 0)
AS DECIMAL(6,2)
) AS SearchSessionRate,
CAST(
100.0 * COUNT(os.SessionID)
/ NULLIF(COUNT(*), 0)
AS DECIMAL(6,2)
) AS PurchaseConversionRate
FROM dbo.Sessions AS s
LEFT JOIN SearchSessions AS ss
ON s.SessionID = ss.SessionID
LEFT JOIN OrderSessions AS os
ON s.SessionID = os.SessionID
GROUP BY s.DeviceType
ORDER BY TotalSessions DESC;

| Device | Total Sessions | Search Sessions | Search Rate | Purchasing Sessions | Purchase Conversion |
| Mobile | 21,991 | 14,273 | 64.90% | 3,352 | 15.24% |
| Desktop | 14,030 | 9,166 | 65.33% | 2,041 | 14.55% |
| Tablet | 3,979 | 2,561 | 64.36% | 607 | 15.26% |
The Search Session Rates are nearly identical across the three device types, while the difference between the highest and lowest Purchase Conversion Rates is only about 0.71 percentage points. Therefore, at the overall Session level, there is no clear indication of a Mobile-specific conversion problem. In fact, Mobile accounts for 54.98% of all Sessions and has a 15.24% Conversion Rate.
However, ShopSense’s central question focuses on highly engaged Search users who fail to convert. A device-level comparison across all Sessions may therefore hide the underlying issue.
The appropriate next step is to calculate Conversion Rate specifically for Sessions with Search activity and directly connect Search behavior and Purchase outcomes within the same Session.
USE ShopSense;
GO
WITH SearchSessions AS
(
SELECT
SessionID,
COUNT(*) AS SearchCount
FROM dbo.Searches
GROUP BY SessionID
),
OrderSessions AS
(
SELECT DISTINCT SessionID
FROM dbo.Orders
)
SELECT
s.DeviceType,
COUNT(*) AS SearchSessions,
SUM(CASE
WHEN os.SessionID IS NOT NULL THEN 1
ELSE 0
END) AS SearchSessionsWithPurchase,
SUM(CASE
WHEN os.SessionID IS NULL THEN 1
ELSE 0
END) AS SearchSessionsWithoutPurchase,
CAST(
100.0 *
SUM(CASE WHEN os.SessionID IS NOT NULL THEN 1 ELSE 0 END)
/ NULLIF(COUNT(*), 0)
AS DECIMAL(6,2)
) AS SearchToPurchaseRate,
CAST(
AVG(CAST(ss.SearchCount AS DECIMAL(10,2)))
AS DECIMAL(10,2)
) AS AvgSearchesPerSearchSession
FROM SearchSessions AS ss
JOIN dbo.Sessions AS s
ON ss.SessionID = s.SessionID
LEFT JOIN OrderSessions AS os
ON ss.SessionID = os.SessionID
GROUP BY s.DeviceType
ORDER BY SearchToPurchaseRate DESC;

| Device | Search Sessions | With Purchase | Without Purchase | Search → Purchase |
| Tablet | 2,561 | 400 | 2,161 | 15.62% |
| Mobile | 14,273 | 2,151 | 12,122 | 15.07% |
| Desktop | 9,166 | 1,329 | 7,837 | 14.50% |
The difference between the highest and lowest Conversion Rates is only 1.12 percentage points. Therefore, we still cannot conclude that Device Type is the primary factor behind non-conversion.
A more important finding is that, out of 26,000 Search Sessions, 22,120 did not result in a Purchase. This means approximately 85.1% of Search Sessions ended without a Purchase. This is precisely the population we need to investigate further.
Step 2.1 — High Search Engagement
We now arrive at the central analytical question of the ShopSense project:
Do highly engaged search sessions convert better or are some users repeatedly searching without purchasing?
USE ShopSense;
GO
WITH SearchActivity AS
(
SELECT
SessionID,
COUNT(*) AS SearchCount
FROM dbo.Searches
GROUP BY SessionID
)
SELECT
SearchCount,
COUNT(*) AS NumberOfSessions,
CAST(
100.0 * COUNT(*)
/ SUM(COUNT(*)) OVER ()
AS DECIMAL(6,2)
) AS SessionPercentage
FROM SearchActivity
GROUP BY SearchCount
ORDER BY SearchCount;

| Search Count | Sessions | Percentage |
| 1 | 12,509 | 48.11% |
| 2 | 9,166 | 35.25% |
| 3 | 3,336 | 12.83% |
| 4 | 820 | 3.15% |
| 5 | 146 | 0.56% |
| 6 | 20 | 0.08% |
| 7 | 3 | 0.01% |
his means that 83.36% of Search Sessions contain only one or two Searches, while only about 3.8% contain four or more Searches. Based on the actual data distribution, it is therefore reasonable to define the Search Engagement segments as follows:
Low Engagement = 1 Search, Medium Engagement = 2–3 Searches, and High Engagement = 4+ Searches.
We now need to determine whether this small but highly engaged group is actually more likely to purchase, or whether repeated searching may instead indicate Search Friction.
Step 2.2 — Conversion Rate by Search Engagement
USE ShopSense;
GO
WITH SearchActivity AS
(
SELECT
SessionID,
COUNT(*) AS SearchCount
FROM dbo.Searches
GROUP BY SessionID
),
SearchSegments AS
(
SELECT
SessionID,
SearchCount,
CASE
WHEN SearchCount = 1 THEN ‘Low’
WHEN SearchCount BETWEEN 2 AND 3 THEN ‘Medium’
ELSE ‘High’
END AS EngagementLevel
FROM SearchActivity
),
PurchaseSessions AS
(
SELECT DISTINCT SessionID
FROM dbo.Orders
)
SELECT
ss.EngagementLevel,
COUNT(*) AS SearchSessions,
SUM(
CASE
WHEN ps.SessionID IS NOT NULL THEN 1
ELSE 0
END
) AS PurchasingSessions,
COUNT(*) –
SUM(
CASE
WHEN ps.SessionID IS NOT NULL THEN 1
ELSE 0
END
) AS NonPurchasingSessions,
CAST(
100.0 *
SUM(
CASE
WHEN ps.SessionID IS NOT NULL THEN 1
ELSE 0
END
)
/ COUNT(*)
AS DECIMAL(6,2)
) AS PurchaseConversionRate,
CAST(
AVG(CAST(ss.SearchCount AS DECIMAL(10,2)))
AS DECIMAL(10,2)
) AS AvgSearchesPerSession
FROM SearchSegments ss
LEFT JOIN PurchaseSessions ps
ON ss.SessionID = ps.SessionID
GROUP BY ss.EngagementLevel
ORDER BY
CASE ss.EngagementLevel
WHEN ‘Low’ THEN 1
WHEN ‘Medium’ THEN 2
WHEN ‘High’ THEN 3
END;

If the results follow a pattern such as Low > Medium > High, we would have evidence that a higher number of Searches does not necessarily indicate positive engagement and may instead signal Search Friction.
However, if the High Engagement group shows a higher Conversion Rate, our initial hypothesis would not be supported, and we would need to investigate the next stage of the Conversion Funnel.
USE ShopSense;
GO
WITH SearchActivity AS
(
SELECT
SessionID,
COUNT(*) AS SearchCount
FROM dbo.Searches
GROUP BY SessionID
),
SearchSegments AS
(
SELECT
SessionID,
SearchCount,
CASE
WHEN SearchCount = 1 THEN ‘Low’
WHEN SearchCount BETWEEN 2 AND 3 THEN ‘Medium’
ELSE ‘High’
END AS EngagementLevel
FROM SearchActivity
),
PurchaseSessions AS
(
SELECT DISTINCT SessionID
FROM dbo.Orders
)
SELECT
ss.EngagementLevel,
COUNT(*) AS SearchSessions,
SUM(
CASE
WHEN ps.SessionID IS NOT NULL THEN 1
ELSE 0
END
) AS PurchasingSessions,
COUNT(*) –
SUM(
CASE
WHEN ps.SessionID IS NOT NULL THEN 1
ELSE 0
END
) AS NonPurchasingSessions,
CAST(
100.0 *
SUM(
CASE
WHEN ps.SessionID IS NOT NULL THEN 1
ELSE 0
END
)
/ COUNT(*)
AS DECIMAL(6,2)
) AS PurchaseConversionRate,
CAST(
AVG(CAST(ss.SearchCount AS DECIMAL(10,2)))
AS DECIMAL(10,2)
) AS AvgSearchesPerSession
FROM SearchSegments ss
LEFT JOIN PurchaseSessions ps
ON ss.SessionID = ps.SessionID
GROUP BY ss.EngagementLevel
ORDER BY
CASE ss.EngagementLevel
WHEN ‘Low’ THEN 1
WHEN ‘Medium’ THEN 2
WHEN ‘High’ THEN 3
END;

So, Our initial hypothesis was not supported by the data.
| Engagement Level | Search Sessions | Purchasing Sessions | Non-Purchasing | Conversion Rate |
| Low — 1 search | 12,509 | 1,849 | 10,660 | 14.78% |
| Medium — 2–3 searches | 12,502 | 1,874 | 10,628 | 14.99% |
| High — 4+ searches | 989 | 157 | 832 | 15.87% |
The Conversion Rate increases from 14.78% → 14.99% → 15.87%. Therefore, at the overall dataset level, a higher number of Searches does not provide clear evidence of Search Friction. In fact, the High Engagement group has the highest Conversion Rate.
However, this result does not invalidate ShopSense’s central analytical question:
Why are some highly engaged search users failing to convert?
Within the High Engagement group, 832 out of 989 Sessions still did not result in a Purchase. This means that 84.13% of High Engagement Sessions ended without a Purchase.
Therefore, rather than simply comparing Conversion Rates, the next step is to investigate where these 832 non-converting High Engagement Sessions drop off within the Conversion Funnel.
Step 2.3 — High-Engagement Search Funnel Analysis
The objective of this stage is to answer the following question:
Why are some highly engaged search users failing to convert?
Step 2.3.1 — Create Analysis View
USE ShopSense;
GO
CREATE OR ALTER VIEW dbo.vw_HighEngagementSessionAnalysis
AS
WITH SearchActivity AS
(
SELECT
SessionID,
COUNT(*) AS SearchCount,
SUM(CASE WHEN ResultsCount = 0 THEN 1 ELSE 0 END) AS ZeroResultSearches,
AVG(CAST(ResultsCount AS DECIMAL(10,2))) AS AvgResultsPerSearch
FROM dbo.Searches
GROUP BY SessionID
),
ProductViewActivity AS
(
SELECT
SessionID,
COUNT(*) AS ProductViewCount,
COUNT(DISTINCT ProductID) AS UniqueProductsViewed
FROM dbo.ProductViews
GROUP BY SessionID
),
CartActivity AS
(
SELECT
SessionID,
SUM(CASE WHEN EventType = ‘Add’ THEN 1 ELSE 0 END) AS AddToCartCount
FROM dbo.CartEvents
GROUP BY SessionID
),
CheckoutActivity AS
(
SELECT
SessionID,
SUM(CASE WHEN EventType = ‘Started’ THEN 1 ELSE 0 END)
AS CheckoutStartedCount
FROM dbo.CheckoutEvents
GROUP BY SessionID
),
OrderActivity AS
(
SELECT
SessionID,
COUNT(*) AS OrderCount,
SUM(TotalAmount) AS Revenue
FROM dbo.Orders
GROUP BY SessionID
)
SELECT
s.SessionID,
s.UserID,
s.DeviceType,
s.TrafficSource,
s.SessionStart,
s.SessionDurationSeconds,
sa.SearchCount,
sa.ZeroResultSearches,
sa.AvgResultsPerSearch,
ISNULL(pv.ProductViewCount, 0) AS ProductViewCount,
ISNULL(pv.UniqueProductsViewed, 0) AS UniqueProductsViewed,
ISNULL(ca.AddToCartCount, 0) AS AddToCartCount,
ISNULL(ch.CheckoutStartedCount, 0) AS CheckoutStartedCount,
ISNULL(oa.OrderCount, 0) AS OrderCount,
ISNULL(oa.Revenue, 0) AS Revenue,
CASE
WHEN ISNULL(pv.ProductViewCount, 0) > 0 THEN 1
ELSE 0
END AS ReachedProductView,
CASE
WHEN ISNULL(ca.AddToCartCount, 0) > 0 THEN 1
ELSE 0
END AS ReachedCart,
CASE
WHEN ISNULL(ch.CheckoutStartedCount, 0) > 0 THEN 1
ELSE 0
END AS ReachedCheckout,
CASE
WHEN ISNULL(oa.OrderCount, 0) > 0 THEN 1
ELSE 0
END AS Purchased,
CASE
WHEN ISNULL(oa.OrderCount, 0) > 0
THEN ‘Purchased’
ELSE ‘No Purchase’
END AS PurchaseStatus
FROM dbo.Sessions s
INNER JOIN SearchActivity sa
ON s.SessionID = sa.SessionID
LEFT JOIN ProductViewActivity pv
ON s.SessionID = pv.SessionID
LEFT JOIN CartActivity ca
ON s.SessionID = ca.SessionID
LEFT JOIN CheckoutActivity ch
ON s.SessionID = ch.SessionID
LEFT JOIN OrderActivity oa
ON s.SessionID = oa.SessionID
WHERE sa.SearchCount >= 4;
GO
Step 2.3.2 — Validation1
SELECT
PurchaseStatus,
COUNT(*) AS Sessions,
CAST(
100.0 * COUNT(*) /
SUM(COUNT(*)) OVER ()
AS DECIMAL(6,2)
) AS Percentage
FROM dbo.vw_HighEngagementSessionAnalysis
GROUP BY PurchaseStatus;

SELECT
COUNT(*) AS HighEngagementSessions,
SUM(Purchased) AS PurchasedSessions,
COUNT(*) – SUM(Purchased) AS NonPurchasingSessions
FROM dbo.vw_HighEngagementSessionAnalysis;

Results:
High Engagement Sessions = 989 → Purchased = 157 (15.87%) → No Purchase = 832 (84.13%)
Step 2.3.3 — Funnel Comparison Between the Two Groups
USE ShopSense;
GO
SELECT
PurchaseStatus,
COUNT(*) AS TotalSessions,
SUM(ReachedProductView) AS ReachedProductView,
CAST(
100.0 * SUM(ReachedProductView) / COUNT(*)
AS DECIMAL(6,2)
) AS ProductViewRate,
SUM(ReachedCart) AS ReachedCart,
CAST(
100.0 * SUM(ReachedCart) / COUNT(*)
AS DECIMAL(6,2)
) AS CartRate,
SUM(ReachedCheckout) AS ReachedCheckout,
CAST(
100.0 * SUM(ReachedCheckout) / COUNT(*)
AS DECIMAL(6,2)
) AS CheckoutRate,
SUM(Purchased) AS PurchasedSessions,
CAST(
100.0 * SUM(Purchased) / COUNT(*)
AS DECIMAL(6,2)
) AS PurchaseRate
FROM dbo.vw_HighEngagementSessionAnalysis
GROUP BY PurchaseStatus
ORDER BY
CASE
WHEN PurchaseStatus = ‘Purchased’ THEN 1
ELSE 2
END;

For the High Engagement + Purchased group, all 157 Sessions reached the Product View, Cart, and Checkout stages. In contrast, within the High Engagement + No Purchase group, all 832 Sessions reached Product View, while only 144 Sessions (17.31%) reached Cart, and only 55 Sessions (6.61%) reached Checkout.
Therefore, the first major ShopSense finding is:
The primary issue does not appear to be at the Search → Product View stage. High-engagement users are viewing products, but a large proportion of non-purchasers drop off after Product View and before Add to Cart.
This is exactly the type of insight that adds value to a Product Analytics project. High Search activity alone did not indicate friction, but once we examined the user journey in greater detail, we identified potential Post-Search / Product-Consideration Friction.
ReachedCheckout for the No Purchase group is 55, while the CheckoutRate is not visible. Based on the data, the rate is:
55/832 * 100 = 6.61%
Therefore, the current funnel for the High Engagement + No Purchase group is:
832 Product Views (100%) → 144 Cart (17.31%) → 55 Checkout (6.61%) → 0 Purchase
Step 2.3.4 — Identifying the Causes of Drop-off Between Product View → Cart
At this point, we know that the High Engagement + No Purchase group contains 832 Sessions. All 832 Sessions reached the Product View stage, but only 144 Sessions reached Cart. Therefore, 688 Sessions dropped off specifically after Product View and before Add to Cart.
The first step is to extract these 688 Sessions as a separate analytical segment and verify that the count is correct.
USE ShopSense;
GO
— 2.3.4
— High Engagement + No Purchase
— Sessions that reached Product View but never reached Cart
WITH SearchActivity AS
(
SELECT
SessionID,
COUNT(*) AS SearchCount
FROM dbo.Searches
GROUP BY SessionID
),
HighEngagementNoPurchase AS
(
SELECT
s.SessionID,
s.UserID,
s.DeviceType,
s.TrafficSource,
s.SessionDurationSeconds,
sa.SearchCount
FROM dbo.Sessions s
INNER JOIN SearchActivity sa
ON s.SessionID = sa.SessionID
WHERE sa.SearchCount >= 4
AND NOT EXISTS
(
SELECT 1
FROM dbo.Orders o
WHERE o.SessionID = s.SessionID
)
),
ProductViewNoCart AS
(
SELECT
h.SessionID,
h.UserID,
h.DeviceType,
h.TrafficSource,
h.SessionDurationSeconds,
h.SearchCount
FROM HighEngagementNoPurchase h
WHERE EXISTS
(
SELECT 1
FROM dbo.ProductViews pv
WHERE pv.SessionID = h.SessionID
)
AND NOT EXISTS
(
SELECT 1
FROM dbo.CartEvents ce
WHERE ce.SessionID = h.SessionID
AND ce.EventType = ‘Add’
)
)
SELECT
COUNT(*) AS ProductViewNoCartSessions
FROM ProductViewNoCart;

832 High Engagement + No Purchase → 688 No Cart + 144 Reached Cart
This means that 82.69% of High-Engagement Non-Purchasers do not even reach the Add-to-Cart stage after viewing products. The next step is to determine what differentiates these 688 Sessions from the 144 Sessions that did reach Cart.
Step 2.3.4.1 — Comparing Product View Behavior
First, we examine whether Sessions that did not reach Cart differ in terms of the number of Product Views and the amount of time spent viewing products.
USE ShopSense;
GO
— 2.3.4.1
— Product View behavior:
— Reached Cart vs No Cart
— within High Engagement + No Purchase sessions
WITH SearchActivity AS
(
SELECT
SessionID,
COUNT(*) AS SearchCount
FROM dbo.Searches
GROUP BY SessionID
),
HighEngagementNoPurchase AS
(
SELECT
s.SessionID,
sa.SearchCount
FROM dbo.Sessions s
INNER JOIN SearchActivity sa
ON s.SessionID = sa.SessionID
WHERE sa.SearchCount >= 4
AND NOT EXISTS
(
SELECT 1
FROM dbo.Orders o
WHERE o.SessionID = s.SessionID
)
),
SessionProductViews AS
(
SELECT
h.SessionID,
COUNT(pv.ProductViewID) AS ProductViewCount,
AVG(CAST(pv.ViewDurationSeconds AS DECIMAL(10,2)))
AS AvgProductViewDuration
FROM HighEngagementNoPurchase h
INNER JOIN dbo.ProductViews pv
ON h.SessionID = pv.SessionID
GROUP BY h.SessionID
),
SessionBehavior AS
(
SELECT
spv.SessionID,
CASE
WHEN EXISTS
(
SELECT 1
FROM dbo.CartEvents ce
WHERE ce.SessionID = spv.SessionID
AND ce.EventType = ‘Add’
)
THEN ‘Reached Cart’
ELSE ‘No Cart’
END AS CartStatus,
spv.ProductViewCount,
spv.AvgProductViewDuration
FROM SessionProductViews spv
)
SELECT
CartStatus,
COUNT(*) AS Sessions,
CAST(
AVG(CAST(ProductViewCount AS DECIMAL(10,2)))
AS DECIMAL(10,2)
) AS AvgProductViewsPerSession,
CAST(
AVG(AvgProductViewDuration)
AS DECIMAL(10,2)
) AS AvgViewDurationSeconds
FROM SessionBehavior
GROUP BY CartStatus
ORDER BY CartStatus;

The differences are very small. No Cart Sessions have, on average, only 0.11 more Product Views and approximately 2.06 seconds more product viewing time.
Therefore, at this stage, there is no evidence that the drop-off is caused by fewer Product Views or less time spent on Product Pages. In fact, No Cart users show nearly the same level of product engagement, yet they do not proceed to Add to Cart.
This is important to the ShopSense analytical narrative: Engagement is present, but that engagement is not translating into the next stage of purchase intent. However, we still cannot determine the underlying cause; we have only weakened one possible explanation.
Step 2.3.4.2 — Does Search Click Behavior Make a Difference?
Next, we examine whether the No Cart group actually clicks on search results after performing a Search.
| Metric | No Cart | Reached Cart | Difference |
| Sessions | 688 | 144 | — |
| Avg Searches / Session | 4.20 | 4.15 | +0.05 |
| Avg Search Clicks / Session | 7.51 | 7.41 | +0.10 |
| Sessions with Search Click | 688 | 144 | — |
| Search Click Session Rate | 100% | 100% | 0 pp |
The No Cart group does not perform fewer Searches; in fact, their average number of Searches and Search Clicks is slightly higher. In addition, 100% of both groups recorded at least one Search Click.
So far, two hypotheses have been weakened. In Step 2.3.4.1, we found that Product View Count and View Duration were nearly identical between the groups. In Step 2.3.4.2, Search activity and Search Click behavior were also very similar.
Therefore, the current data story is:
High-engagement non-purchasers are actively searching, clicking search results, and viewing products, but most fail to progress from product consideration to Add to Cart.
This is an important finding for the ShopSense case study, but we still cannot say why this behavior occurs. At this stage, we have only narrowed down where the potential friction occurs.
Step 2.3.4.3 — Are the Viewed Products Different?
The next logical step is to investigate whether the No Cart group views products with different characteristics in terms of Price, Discount, Rating, or Stock Availability.
USE ShopSense;
GO
— 2.3.4.3
— Product characteristics
— Reached Cart vs No Cart
— High Engagement + No Purchase
WITH SearchActivity AS
(
SELECT
SessionID,
COUNT(*) AS SearchCount
FROM dbo.Searches
GROUP BY SessionID
),
HighEngagementNoPurchase AS
(
SELECT
s.SessionID
FROM dbo.Sessions s
INNER JOIN SearchActivity sa
ON s.SessionID = sa.SessionID
WHERE sa.SearchCount >= 4
AND NOT EXISTS
(
SELECT 1
FROM dbo.Orders o
WHERE o.SessionID = s.SessionID
)
),
SessionCartStatus AS
(
SELECT
h.SessionID,
CASE
WHEN EXISTS
(
SELECT 1
FROM dbo.CartEvents ce
WHERE ce.SessionID = h.SessionID
AND ce.EventType = ‘Add’
)
THEN ‘Reached Cart’
ELSE ‘No Cart’
END AS CartStatus
FROM HighEngagementNoPurchase h
),
SessionProductMetrics AS
(
SELECT
cs.SessionID,
cs.CartStatus,
AVG(CAST(p.ListPrice AS DECIMAL(18,2)))
AS AvgViewedPrice,
AVG(CAST(p.DiscountPercent AS DECIMAL(18,2)))
AS AvgViewedDiscount,
AVG(CAST(p.Rating AS DECIMAL(18,2)))
AS AvgViewedRating,
AVG(CAST(p.StockQuantity AS DECIMAL(18,2)))
AS AvgViewedStock
FROM SessionCartStatus cs
INNER JOIN dbo.ProductViews pv
ON cs.SessionID = pv.SessionID
INNER JOIN dbo.Products p
ON pv.ProductID = p.ProductID
GROUP BY
cs.SessionID,
cs.CartStatus
)
SELECT
CartStatus,
COUNT(*) AS Sessions,
CAST(AVG(AvgViewedPrice)
AS DECIMAL(10,2)) AS AvgViewedPrice,
CAST(AVG(AvgViewedDiscount)
AS DECIMAL(10,2)) AS AvgViewedDiscountPercent,
CAST(AVG(AvgViewedRating)
AS DECIMAL(10,2)) AS AvgViewedRating,
CAST(AVG(AvgViewedStock)
AS DECIMAL(10,2)) AS AvgViewedStock
FROM SessionProductMetrics
GROUP BY CartStatus
ORDER BY CartStatus;

These differences are small. More importantly, the direction of Price and Stock Availability is not consistent with the simple hypothesis that No Cart users are viewing more expensive products or products with lower stock availability. Therefore, at this stage, Price, Discount, Rating, and Stock do not provide a clear explanation for the failure to Add to Cart.
So far, we have weakened three straightforward explanations: Product View behavior is nearly identical, Search/Click behavior is nearly identical, and general product characteristics are also very similar. This is exactly what moves the analysis beyond simple KPI reporting toward diagnostic product analysis.
Step 2.3.4.4 — Is the Problem Related to Category Mix?
We now need to go one level deeper. Although average Price and Rating may be similar between the groups, the No Cart group may be viewing a different mix of product Categories.
USE ShopSense;
GO
— 2.3.4.4
— Category-level Cart Progression
— High Engagement + No Purchase only
WITH SearchActivity AS
(
SELECT
SessionID,
COUNT(*) AS SearchCount
FROM dbo.Searches
GROUP BY SessionID
),
HighEngagementNoPurchase AS
(
SELECT
s.SessionID
FROM dbo.Sessions s
INNER JOIN SearchActivity sa
ON s.SessionID = sa.SessionID
WHERE sa.SearchCount >= 4
AND NOT EXISTS
(
SELECT 1
FROM dbo.Orders o
WHERE o.SessionID = s.SessionID
)
),
SessionCartStatus AS
(
SELECT
h.SessionID,
CASE
WHEN EXISTS
(
SELECT 1
FROM dbo.CartEvents ce
WHERE ce.SessionID = h.SessionID
AND ce.EventType = ‘Add’
)
THEN 1
ELSE 0
END AS ReachedCart
FROM HighEngagementNoPurchase h
),
SessionCategories AS
(
SELECT DISTINCT
cs.SessionID,
cs.ReachedCart,
p.CategoryID
FROM SessionCartStatus cs
INNER JOIN dbo.ProductViews pv
ON cs.SessionID = pv.SessionID
INNER JOIN dbo.Products p
ON pv.ProductID = p.ProductID
)
SELECT
c.CategoryID,
c.CategoryName,
COUNT(*) AS SessionsViewingCategory,
SUM(sc.ReachedCart) AS ReachedCartSessions,
COUNT(*) – SUM(sc.ReachedCart) AS NoCartSessions,
CAST(
100.0 * SUM(sc.ReachedCart)
/ NULLIF(COUNT(*), 0)
AS DECIMAL(6,2)
) AS CartProgressionRate
FROM SessionCategories sc
INNER JOIN dbo.Categories c
ON sc.CategoryID = c.CategoryID
GROUP BY
c.CategoryID,
c.CategoryName
ORDER BY
CartProgressionRate ASC,
SessionsViewingCategory DESC;


The lowest Cart Progression Rate is observed for Furniture at 13.88%, while the highest is Travel at 19.71%, representing a range of approximately 5.83 percentage points. Other Categories at the higher end of the table include Shoes = 18.15%, Accessories = 18.73%, Skincare = 18.75%, Fiction = 19.03%, and Smart Home = 19.46%.
This indicates that Category is associated with some variation in Cart Progression, but no individual Category shows an exceptionally severe or unusual drop-off. Therefore, we will retain Category as a potential secondary factor, but there is currently insufficient evidence to consider it the primary explanation for the 688 No Cart Sessions.
So far, our diagnostic path has developed systematically:
Product Views are nearly identical → Search/Clicks are nearly identical → Product Characteristics are nearly identical → Category shows only limited variation.
The next logical step is:
Step 2.3.4.5 — Device × Cart Progression
This analysis is important because we now want to determine whether the substantial pre-Cart drop-off is concentrated among Mobile, Desktop, or Tablet Sessions.
USE ShopSense;
GO
— 2.3.4.5
— Device × Cart Progression
— High Engagement + No Purchase only
WITH SearchActivity AS
(
SELECT
SessionID,
COUNT(*) AS SearchCount
FROM dbo.Searches
GROUP BY SessionID
),
HighEngagementNoPurchase AS
(
SELECT
s.SessionID,
s.DeviceType
FROM dbo.Sessions s
INNER JOIN SearchActivity sa
ON s.SessionID = sa.SessionID
WHERE sa.SearchCount >= 4
AND NOT EXISTS
(
SELECT 1
FROM dbo.Orders o
WHERE o.SessionID = s.SessionID
)
),
SessionCartStatus AS
(
SELECT
h.SessionID,
h.DeviceType,
CASE
WHEN EXISTS
(
SELECT 1
FROM dbo.CartEvents ce
WHERE ce.SessionID = h.SessionID
AND ce.EventType = ‘Add’
)
THEN 1
ELSE 0
END AS ReachedCart
FROM HighEngagementNoPurchase h
)
SELECT
DeviceType,
COUNT(*) AS TotalSessions,
SUM(ReachedCart) AS ReachedCartSessions,
COUNT(*) – SUM(ReachedCart) AS NoCartSessions,
CAST(
100.0 * SUM(ReachedCart)
/ NULLIF(COUNT(*), 0)
AS DECIMAL(6,2)
) AS CartProgressionRate
FROM SessionCartStatus
GROUP BY DeviceType
ORDER BY CartProgressionRate ASC;

Key Finding
Contrary to our initial hypothesis about Mobile users, Mobile is not the weakest-performing device. The lowest Cart Progression Rate is observed on Desktop at 14.59%, compared with 18.05% for Mobile and 22.50% for Tablet.
The gap between Desktop and Tablet is 7.91 percentage points, while the difference between Desktop and Mobile is 3.46 percentage points. These differences are more pronounced than many of the variations observed in the previous diagnostic steps.
However, we should not yet conclude that Desktop is the cause of the problem. Desktop Sessions may simply have a different mix of Traffic Sources, Categories, or User segments.
Step 2.3.4.6 — Traffic Source × Cart Progression
Next, we examine whether the Session Traffic Source provides a stronger explanation for the observed differences in Cart Progression.
USE ShopSense;
GO
— 2.3.4.6
— Traffic Source × Cart Progression
— High Engagement + No Purchase only
WITH SearchActivity AS
(
SELECT
SessionID,
COUNT(*) AS SearchCount
FROM dbo.Searches
GROUP BY SessionID
),
HighEngagementNoPurchase AS
(
SELECT
s.SessionID,
s.TrafficSource
FROM dbo.Sessions s
INNER JOIN SearchActivity sa
ON s.SessionID = sa.SessionID
WHERE sa.SearchCount >= 4
AND NOT EXISTS
(
SELECT 1
FROM dbo.Orders o
WHERE o.SessionID = s.SessionID
)
),
SessionCartStatus AS
(
SELECT
h.SessionID,
h.TrafficSource,
CASE
WHEN EXISTS
(
SELECT 1
FROM dbo.CartEvents ce
WHERE ce.SessionID = h.SessionID
AND ce.EventType = ‘Add’
)
THEN 1
ELSE 0
END AS ReachedCart
FROM HighEngagementNoPurchase h
)
SELECT
TrafficSource,
COUNT(*) AS TotalSessions,
SUM(ReachedCart) AS ReachedCartSessions,
COUNT(*) – SUM(ReachedCart) AS NoCartSessions,
CAST(
100.0 * SUM(ReachedCart)
/ NULLIF(COUNT(*),0)
AS DECIMAL(6,2)
) AS CartProgressionRate
FROM SessionCartStatus
GROUP BY TrafficSource
ORDER BY CartProgressionRate ASC;
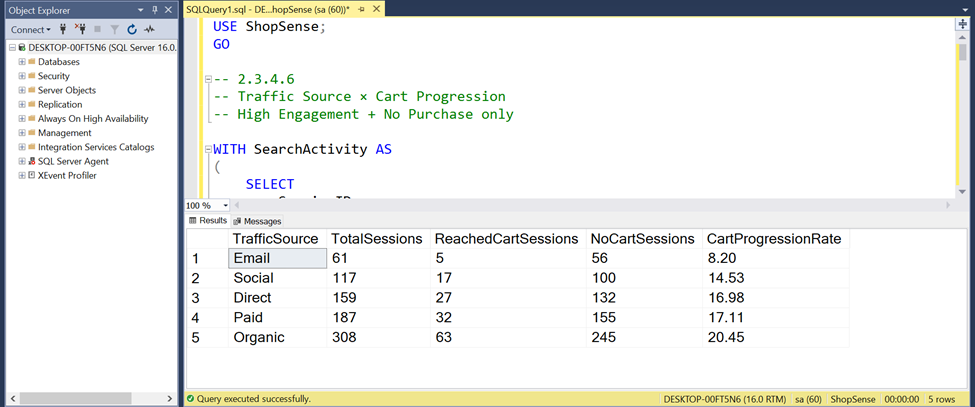
This result shows a stronger signal than either Category or Device, and the totals are internally consistent: 832 Sessions, including 144 Reached Cart Sessions and 688 No Cart Sessions.
Across Traffic Sources, the Cart Progression Rate ranges from 8.20% for Email to 20.45% for Organic, representing a difference of 12.25 percentage points. Email has only 5 Reached Cart Sessions out of 61, while Social is also relatively low at 14.53%. In contrast, Organic reaches 20.45% across 308 Sessions.
Therefore, Traffic Source is currently the strongest segmentation signal identified in our diagnostic analysis. However, this association still does not establish the underlying cause of the drop-off.
As planned, the next step is to examine the interaction between Device and Traffic Source to determine whether combining these two dimensions reveals a more concentrated pattern.
2.3.4.7 — Device × Traffic Source × Cart Progression
USE ShopSense;
GO
— 2.3.4.7
— Device × Traffic Source × Cart Progression
— High Engagement + No Purchase only
WITH SearchActivity AS
(
SELECT
SessionID,
COUNT(*) AS SearchCount
FROM dbo.Searches
GROUP BY SessionID
),
HighEngagementNoPurchase AS
(
SELECT
s.SessionID,
s.DeviceType,
s.TrafficSource
FROM dbo.Sessions s
INNER JOIN SearchActivity sa
ON s.SessionID = sa.SessionID
WHERE sa.SearchCount >= 4
AND NOT EXISTS
(
SELECT 1
FROM dbo.Orders o
WHERE o.SessionID = s.SessionID
)
),
SessionCartStatus AS
(
SELECT
h.SessionID,
h.DeviceType,
h.TrafficSource,
CASE
WHEN EXISTS
(
SELECT 1
FROM dbo.CartEvents ce
WHERE ce.SessionID = h.SessionID
AND ce.EventType = ‘Add’
)
THEN 1
ELSE 0
END AS ReachedCart
FROM HighEngagementNoPurchase h
)
SELECT
DeviceType,
TrafficSource,
COUNT(*) AS TotalSessions,
SUM(ReachedCart) AS ReachedCartSessions,
COUNT(*) – SUM(ReachedCart) AS NoCartSessions,
CAST(
100.0 * SUM(ReachedCart)
/ NULLIF(COUNT(*), 0)
AS DECIMAL(6,2)
) AS CartProgressionRate
FROM SessionCartStatus
GROUP BY
DeviceType,
TrafficSource
ORDER BY
CartProgressionRate ASC,
TotalSessions DESC;
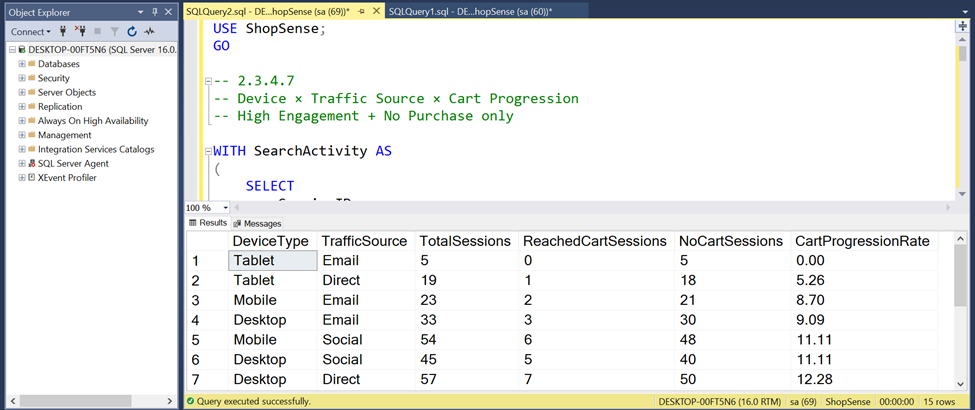
This output reveals an important pattern: Traffic Source appears to be a stronger signal than Device, and the cross-analysis further supports this observation.
Among the segments with a reasonable number of Sessions, Email performs poorly across both major device types: Mobile + Email = 8.70% and Desktop + Email = 9.09%. Similarly, Social shows an 11.11% Cart Progression Rate for both Mobile and Desktop. This suggests that the weaker performance associated with Email is not limited to either Desktop or Mobile.
Although Tablet + Email = 0% appears notable, this segment contains only 5 Sessions, so it is too small to support a reliable conclusion. Likewise, Tablet + Direct = 5.26% is based on only 19 Sessions and should be interpreted cautiously.
In the second part of the analysis, Desktop + Organic = 18.48% and Mobile + Organic = 19.90%, indicating that Organic performs relatively strongly and consistently across the two main device types. In contrast, as observed previously, Email performs poorly on both Mobile (8.70%) and Desktop (9.09%). This consistency across devices provides further evidence that the observed variation is more strongly associated with Traffic Source than with Device itself.
Mobile + Direct = 22.89% is also noteworthy because it is based on a relatively meaningful sample of 83 Sessions. However, Tablet + Organic = 32.00% and Tablet + Social = 33.33% should be interpreted cautiously, as they are based on only 25 and 18 Sessions, respectively. This illustrates exactly why the next statistical validation step is necessary.
Therefore, the preliminary conclusion from Step 2.3.4.7 is that, within the High Engagement + No Purchase segment, Traffic Source shows a stronger signal for Cart Progression than Device. In particular, Email consistently shows lower Cart Progression, while Organic performs relatively strongly.
However, we still should not interpret Traffic Source as the cause of the observed differences; at this stage, the results indicate an association rather than causation.
2.3.5 – Statistical Validation
So far, our SQL analysis has shown that within the High Engagement + No Purchase group, Cart Progression Rates vary across Traffic Sources. The next step is to determine whether these differences are statistically reliable or could simply be the result of sampling variation.
The most appropriate comparison to begin with is Organic vs. Email.
Organic: 63 out of 308 Sessions → 20.45%
Email: 5 out of 61 Sessions → 8.20%
Observed Difference: 12.25 percentage points
2.3.5.1 — Organic vs. Email: Statistical Significance
We define the hypotheses as follows:
H₀ (Null Hypothesis): The Cart Progression Rates for Organic and Email are equal.
H₁ (Alternative Hypothesis): The Cart Progression Rates for Organic and Email are different.
Because our outcome variable is binary a Session either reaches Cart or does not the appropriate statistical test is a Two-Proportion Z-Test.
USE ShopSense;
GO
— 2.3.5.1
— Statistical Validation Dataset
— Organic vs Email
— High Engagement + No Purchase only
WITH SearchActivity AS
(
SELECT
SessionID,
COUNT(*) AS SearchCount
FROM dbo.Searches
GROUP BY SessionID
),
HighEngagementNoPurchase AS
(
SELECT
s.SessionID,
s.TrafficSource
FROM dbo.Sessions s
INNER JOIN SearchActivity sa
ON s.SessionID = sa.SessionID
WHERE sa.SearchCount >= 4
AND NOT EXISTS
(
SELECT 1
FROM dbo.Orders o
WHERE o.SessionID = s.SessionID
)
AND s.TrafficSource IN (‘Organic’, ‘Email’)
),
SessionCart AS
(
SELECT
h.SessionID,
h.TrafficSource,
CASE
WHEN EXISTS
(
SELECT 1
FROM dbo.CartEvents ce
WHERE ce.SessionID = h.SessionID
AND ce.EventType = ‘Add’
)
THEN 1
ELSE 0
END AS ReachedCart
FROM HighEngagementNoPurchase h
)
SELECT
TrafficSource,
COUNT(*) AS TotalSessions,
SUM(ReachedCart) AS ReachedCartSessions,
COUNT(*) – SUM(ReachedCart) AS NoCartSessions,
CAST(
100.0 * SUM(ReachedCart)
/ NULLIF(COUNT(*), 0)
AS DECIMAL(6,2)
) AS CartProgressionRate
FROM SessionCart
GROUP BY TrafficSource
ORDER BY TrafficSource;
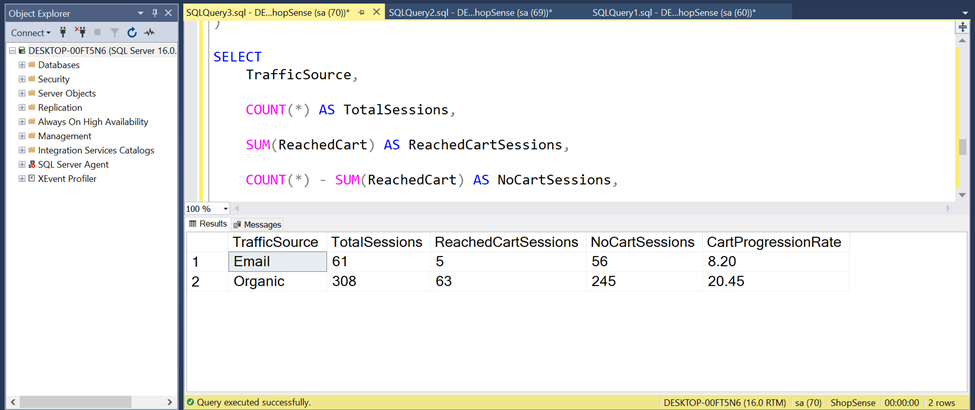
2.3.5.2 — Two-Proportion Z-Test
We now move into the Python environment:
import numpy as np
from statsmodels.stats.proportion import proportions_ztest
# Organic
organic_success = 63
organic_total = 308
email_success = 5
email_total = 61
successes = np.array([organic_success, email_success])
observations = np.array([organic_total, email_total])
z_stat, p_value = proportions_ztest(
count=successes,
nobs=observations,
alternative=’two-sided’
)
organic_rate = organic_success / organic_total
email_rate = email_success / email_total
difference = organic_rate – email_rate
print(f”Organic Cart Progression Rate: {organic_rate:.2%}”)
print(f”Email Cart Progression Rate: {email_rate:.2%}”)
print(f”Absolute Difference: {difference:.2%}”)
print(f”Z-statistic: {z_stat:.4f}”)
print(f”P-value: {p_value:.4f}”)
H₀: Organic Cart Progression Rate = Email Cart Progression Rate
H₁: Organic Cart Progression Rate ≠ Email Cart Progression Rate
α = 0.05
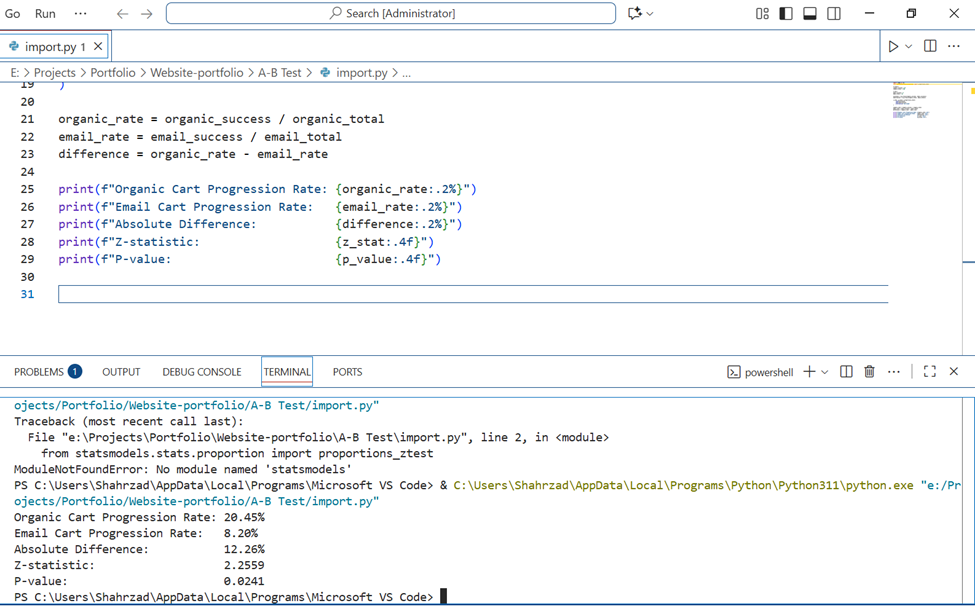
| Metric | Result |
| Organic Cart Progression Rate | 20.45% |
| Email Cart Progression Rate | 8.20% |
| Absolute Difference | 12.26 percentage points |
| Z-statistic | 2.2559 |
| P-value | 0.0241 |
p = 0.0241 < α = 0.05
At the 5% significance level, we reject the null hypothesis (H₀). This indicates that, within the ShopSense dataset, there is statistically significant evidence of a difference in Cart Progression Rates between Organic and Email for the High Engagement + No Purchase group.
Among High Engagement + No Purchase sessions, Organic traffic showed a significantly higher Cart Progression Rate than Email traffic (20.45% vs. 8.20%; two-proportion z-test, z = 2.256, p = 0.024).
2.3.5.3 — 95% Confidence Interval + Effect Size
Now we need to answer a more important question: How large is this difference, and what is its plausible range?
import numpy as np
from statsmodels.stats.proportion import (
proportions_ztest,
confint_proportions_2indep,
proportion_effectsize
)
# ————————————————–
# ShopSense
# 2.3.5 Statistical Validation
# Organic vs Email Cart Progression
# High Engagement + No Purchase
# ————————————————–
# Organic
organic_success = 63
organic_total = 308
email_success = 5
email_total = 61
# ————————————————–
# 1. Cart Progression Rates
# ————————————————–
organic_rate = organic_success / organic_total
email_rate = email_success / email_total
difference = organic_rate – email_rate
# ————————————————–
# 2. Two-Proportion Z-Test
# ————————————————–
successes = np.array([
organic_success,
email_success
])
observations = np.array([
organic_total,
email_total
])
z_stat, p_value = proportions_ztest(
count=successes,
nobs=observations,
alternative=’two-sided’
)
# ————————————————–
# 3. 95% Confidence Interval
# ————————————————–
ci_low, ci_high = confint_proportions_2indep(
count1=organic_success,
nobs1=organic_total,
count2=email_success,
nobs2=email_total,
method=’wald’,
compare=’diff’,
alpha=0.05
)
# ————————————————–
# 4. Effect Size – Cohen’s h
# ————————————————–
cohens_h = proportion_effectsize(
organic_rate,
email_rate
)
# ————————————————–
# 5. Results
# ————————————————–
print(“SHOPSense Statistical Validation”)
print(“——————————–“)
print(f”Organic Cart Progression Rate: {organic_rate:.2%}”)
print(f”Email Cart Progression Rate: {email_rate:.2%}”)
print(f”Absolute Difference: {difference:.2%}”)
print(“\nTwo-Proportion Z-Test”)
print(f”Z-statistic: {z_stat:.4f}”)
print(f”P-value: {p_value:.4f}”)
print(“\nEffect & Uncertainty”)
print(f”95% Confidence Interval: [{ci_low:.2%}, {ci_high:.2%}]”)
print(f”Cohen’s h: {cohens_h:.4f}”)
print(“\nDecision”)
if p_value < 0.05:
print(“Reject H0: The difference is statistically significant.”)
else:
print(“Fail to reject H0: The difference is not statistically significant.”)
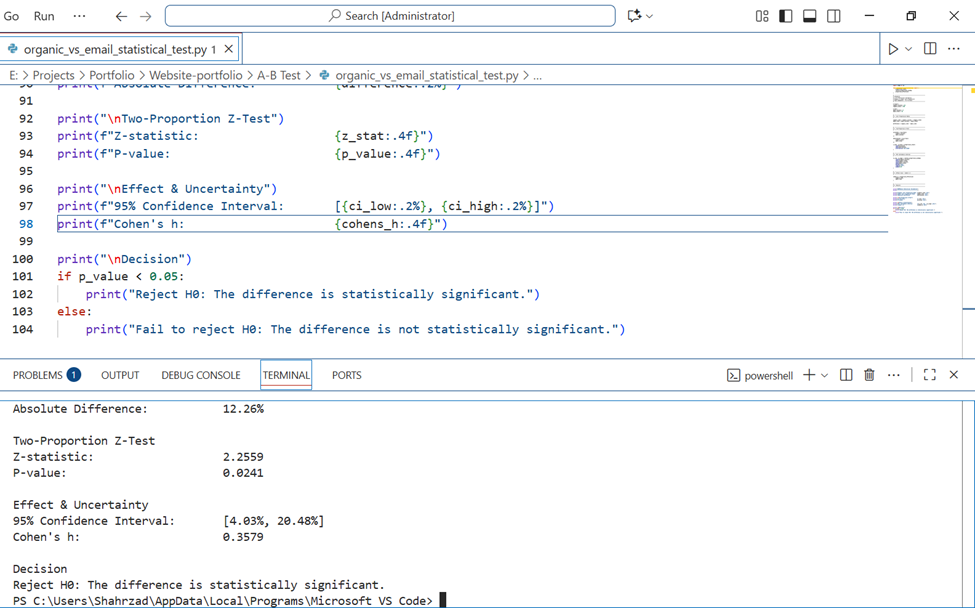
| Metric | Result |
| Organic Cart Progression Rate | 20.45% |
| Email Cart Progression Rate | 8.20% |
| Absolute Difference | 12.26 percentage points |
| Z-statistic | 2.2559 |
| P-value | 0.0241 |
| 95% CI for Difference | [4.03%, 20.48%] |
| Cohen’s h | 0.3579 |
Organic vs Email: Statistical Significance
Among High Engagement + No Purchase sessions, Organic traffic showed a 20.45% Cart Progression Rate (63/308) compared with 8.20% (5/61) for Email traffic, representing an observed difference of approximately 12.26 percentage points.
A two-proportion z-test found this difference to be statistically significant (z = 2.256, p = 0.024). The 95% confidence interval for the difference was 4.03 to 20.48 percentage points, which does not include zero and therefore supports the statistical-test result.
The standardized effect size was Cohen’s h = 0.358, indicating a difference between a small and medium effect under conventional benchmarks.
These results provide evidence that Cart Progression differs between Organic and Email sessions within this segment. However, because this is observational traffic-source data rather than a randomized experiment, the result should be interpreted as an association rather than a causal effect of traffic source.
2.3.6 — Email Traffic Deep Dive
Within the High Engagement + No Purchase group, the Cart Progression Rate is 20.45% (63/308) for Organic and 8.20% (5/61) for Email. The observed difference is 12.26 percentage points and is statistically significant (p = 0.0241).
The key question for Step 2.3.6 is:
Why does Email traffic show substantially lower Cart Progression than Organic traffic among High Engagement + No Purchase sessions?
2.3.6.1 — Email vs Organic by Device
First, we need to determine whether the lower Cart Progression Rate for Email is simply explained by its Device mix. For example, if a large proportion of Email Sessions comes from a device type with a lower Cart Progression Rate, then Traffic Source itself may not be the primary factor associated with the difference.
USE ShopSense;
GO
— 2.3.6.1
— Email vs Organic by Device
— High Engagement + No Purchase only
WITH SearchActivity AS
(
SELECT
SessionID,
COUNT(*) AS SearchCount
FROM dbo.Searches
GROUP BY SessionID
),
HighEngagementNoPurchase AS
(
SELECT
s.SessionID,
s.DeviceType,
s.TrafficSource
FROM dbo.Sessions s
INNER JOIN SearchActivity sa
ON s.SessionID = sa.SessionID
WHERE sa.SearchCount >= 4
AND s.TrafficSource IN (‘Organic’, ‘Email’)
AND NOT EXISTS
(
SELECT 1
FROM dbo.Orders o
WHERE o.SessionID = s.SessionID
)
),
SessionCart AS
(
SELECT
h.SessionID,
h.TrafficSource,
h.DeviceType,
CASE
WHEN EXISTS
(
SELECT 1
FROM dbo.CartEvents ce
WHERE ce.SessionID = h.SessionID
AND ce.EventType = ‘Add’
)
THEN 1
ELSE 0
END AS ReachedCart
FROM HighEngagementNoPurchase h
)
SELECT
TrafficSource,
DeviceType,
COUNT(*) AS TotalSessions,
SUM(ReachedCart) AS ReachedCartSessions,
COUNT(*) – SUM(ReachedCart) AS NoCartSessions,
CAST(
100.0 * SUM(ReachedCart)
/ NULLIF(COUNT(*), 0)
AS DECIMAL(6,2)
) AS CartProgressionRate
FROM SessionCart
GROUP BY
TrafficSource,
DeviceType
ORDER BY
DeviceType,
TrafficSource;
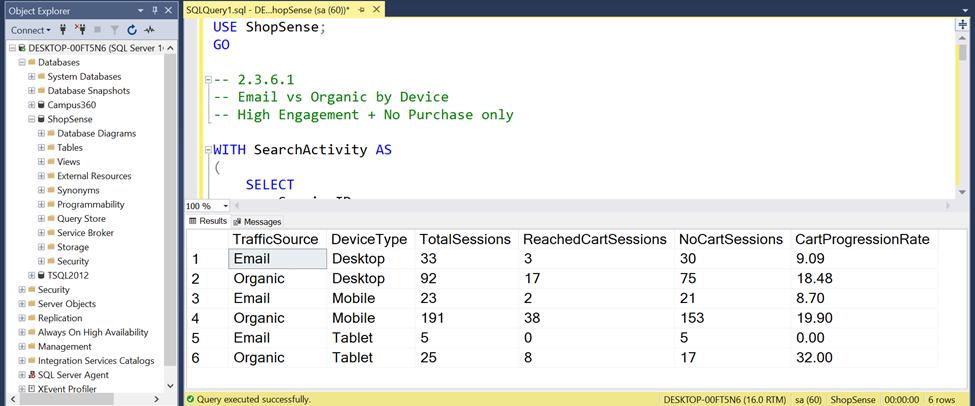
Device Mix Finding:
The lower Cart Progression Rate observed for Email traffic does not appear to be explained solely by device composition. Organic sessions showed higher Cart Progression than Email on both Desktop (18.48% vs. 9.09%) and Mobile (19.90% vs. 8.70%). Tablet showed an even larger difference (32.00% vs. 0.00%), although the Email sample contained only five Tablet sessions and should therefore be interpreted cautiously.
2.3.6.2 — Does Search Behavior Differ for Email?
The next question is:
Despite being classified as High Engagement, do Email users behave differently from Organic users in terms of the number of Searches, Search Clicks, and Product Views?
USE ShopSense;
GO
— 2.3.6.2
— Search & Product Discovery Behavior
— Email vs Organic
— High Engagement + No Purchase only
WITH SearchActivity AS
(
SELECT
SessionID,
COUNT(*) AS SearchCount
FROM dbo.Searches
GROUP BY SessionID
),
HighEngagementNoPurchase AS
(
SELECT
s.SessionID,
s.TrafficSource,
sa.SearchCount
FROM dbo.Sessions s
INNER JOIN SearchActivity sa
ON s.SessionID = sa.SessionID
WHERE sa.SearchCount >= 4
AND s.TrafficSource IN (‘Organic’, ‘Email’)
AND NOT EXISTS
(
SELECT 1
FROM dbo.Orders o
WHERE o.SessionID = s.SessionID
)
),
SearchClickActivity AS
(
SELECT
se.SessionID,
COUNT(sc.ClickID) AS SearchClickCount
FROM dbo.Searches se
LEFT JOIN dbo.SearchImpressions si
ON se.SearchID = si.SearchID
LEFT JOIN dbo.SearchClicks sc
ON si.ImpressionID = sc.ImpressionID
GROUP BY se.SessionID
),
ProductViewActivity AS
(
SELECT
SessionID,
COUNT(*) AS ProductViewCount,
AVG(CAST(ViewDurationSeconds AS DECIMAL(10,2)))
AS AvgViewDurationSeconds
FROM dbo.ProductViews
GROUP BY SessionID
),
SessionMetrics AS
(
SELECT
h.SessionID,
h.TrafficSource,
h.SearchCount,
ISNULL(sc.SearchClickCount, 0) AS SearchClickCount,
ISNULL(pv.ProductViewCount, 0) AS ProductViewCount,
ISNULL(pv.AvgViewDurationSeconds, 0) AS AvgViewDurationSeconds
FROM HighEngagementNoPurchase h
LEFT JOIN SearchClickActivity sc
ON h.SessionID = sc.SessionID
LEFT JOIN ProductViewActivity pv
ON h.SessionID = pv.SessionID
)
SELECT
TrafficSource,
COUNT(*) AS TotalSessions,
CAST(
AVG(CAST(SearchCount AS DECIMAL(10,2)))
AS DECIMAL(10,2)
) AS AvgSearchesPerSession,
CAST(
AVG(CAST(SearchClickCount AS DECIMAL(10,2)))
AS DECIMAL(10,2)
) AS AvgSearchClicksPerSession,
CAST(
AVG(CAST(ProductViewCount AS DECIMAL(10,2)))
AS DECIMAL(10,2)
) AS AvgProductViewsPerSession,
CAST(
AVG(AvgViewDurationSeconds)
AS DECIMAL(10,2)
) AS AvgProductViewDurationSeconds
FROM SessionMetrics
GROUP BY TrafficSource
ORDER BY TrafficSource;
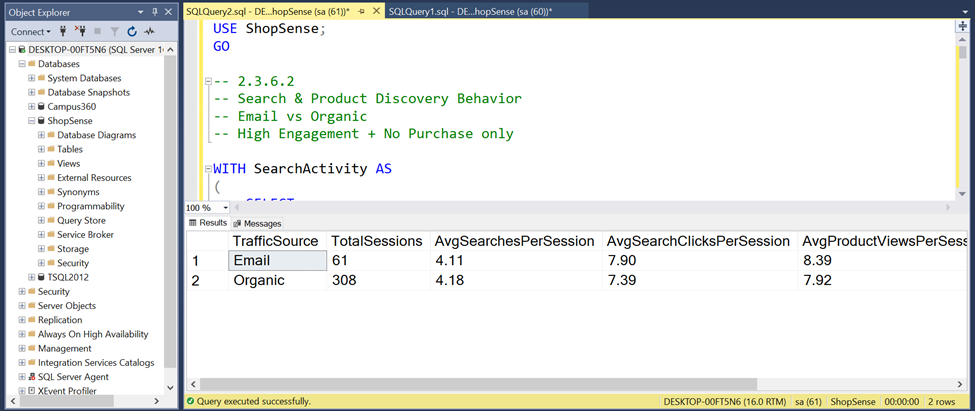
Search & Product Discovery Behavior
Within the High Engagement + No Purchase segment, Email and Organic sessions showed broadly similar search and product-discovery behavior. Email sessions averaged 4.11 searches, 7.90 search clicks, and 8.39 product views per session, compared with 4.18, 7.39, and 7.92 for Organic sessions. Average product-view duration was slightly lower for Email (243.02 vs. 254.81 seconds). These results suggest that the substantially lower Email Cart Progression Rate (8.20% vs. 20.45%) is unlikely to be explained simply by weaker search or browsing engagement.
2.3.6.3 — Product / Category Mix
2.3.6.3.1 — Category Mix by Traffic Source
Are Email users being directed toward Products or Categories that inherently have lower Cart Progression Rates?
This step is important because the issue may not be related to Email itself. For example, Email campaigns may direct users disproportionately toward Furniture, Laptops, or other Categories that already exhibit lower Cart Progression Rates.
USE ShopSense;
GO
— 2.3.6.3.1
— Category Mix: Email vs Organic
— High Engagement + No Purchase only
— High Engagement = SearchCount >= 4
WITH SearchActivity AS
(
SELECT
SessionID,
COUNT(*) AS SearchCount
FROM dbo.Searches
GROUP BY SessionID
),
TargetSessions AS
(
SELECT
s.SessionID,
s.TrafficSource
FROM dbo.Sessions s
INNER JOIN SearchActivity sa
ON s.SessionID = sa.SessionID
WHERE
sa.SearchCount >= 4
AND s.TrafficSource IN (‘Email’, ‘Organic’)
AND NOT EXISTS
(
SELECT 1
FROM dbo.Orders o
WHERE o.SessionID = s.SessionID
)
),
SessionCategories AS
(
SELECT DISTINCT
ts.SessionID,
ts.TrafficSource,
c.CategoryID,
c.CategoryName
FROM TargetSessions ts
INNER JOIN dbo.ProductViews pv
ON pv.SessionID = ts.SessionID
INNER JOIN dbo.Products p
ON p.ProductID = pv.ProductID
INNER JOIN dbo.Categories c
ON c.CategoryID = p.CategoryID
),
CategoryCounts AS
(
SELECT
TrafficSource,
CategoryID,
CategoryName,
COUNT(*) AS SessionsViewingCategory
FROM SessionCategories
GROUP BY
TrafficSource,
CategoryID,
CategoryName
),
SourceTotals AS
(
SELECT
TrafficSource,
COUNT(*) AS TotalSessions
FROM TargetSessions
GROUP BY TrafficSource
)
SELECT
cc.TrafficSource,
cc.CategoryID,
cc.CategoryName,
cc.SessionsViewingCategory,
st.TotalSessions,
CAST(
100.0 * cc.SessionsViewingCategory
/ NULLIF(st.TotalSessions, 0)
AS DECIMAL(6,2)
) AS CategoryReachPercent
FROM CategoryCounts cc
INNER JOIN SourceTotals st
ON st.TrafficSource = cc.TrafficSource
ORDER BY
cc.CategoryName,
cc.TrafficSource;
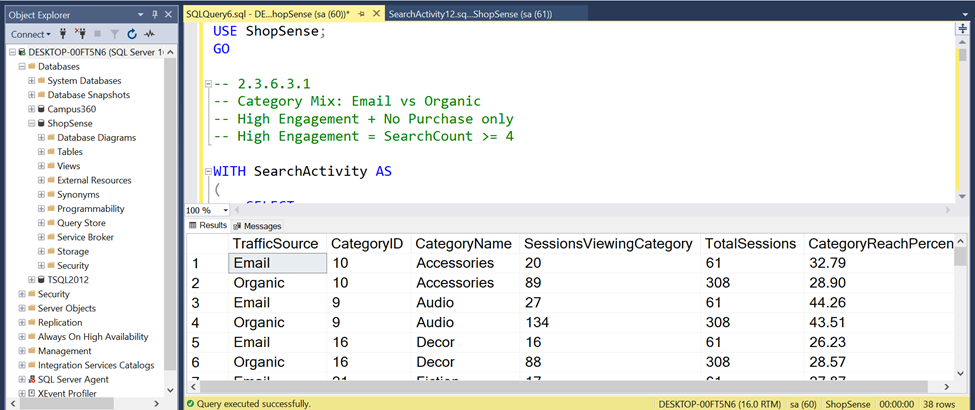
The difference in Category Mix does not appear particularly large at this stage. For example, Accessories accounts for 32.79% of Email views versus 28.90% of Organic views, Audio accounts for 44.26% versus 43.51%, and Decor accounts for 26.23% versus 28.57%.
However, to draw a reliable conclusion, we need to compare the distribution across all 19 Categories, rather than relying on a few individual examples.
2.3.6.3.2 — Calculating the Difference in Category Mix
USE ShopSense;
GO
— 2.3.6.3.2
— Category Mix Difference: Email vs Organic
— High Engagement + No Purchase only
— High Engagement = SearchCount >= 4
WITH SearchActivity AS
(
SELECT
SessionID,
COUNT(*) AS SearchCount
FROM dbo.Searches
GROUP BY SessionID
),
TargetSessions AS
(
SELECT
s.SessionID,
s.TrafficSource
FROM dbo.Sessions s
INNER JOIN SearchActivity sa
ON s.SessionID = sa.SessionID
WHERE
sa.SearchCount >= 4
AND s.TrafficSource IN (‘Email’, ‘Organic’)
AND NOT EXISTS
(
SELECT 1
FROM dbo.Orders o
WHERE o.SessionID = s.SessionID
)
),
SessionCategories AS
(
SELECT DISTINCT
ts.SessionID,
ts.TrafficSource,
c.CategoryID,
c.CategoryName
FROM TargetSessions ts
INNER JOIN dbo.ProductViews pv
ON pv.SessionID = ts.SessionID
INNER JOIN dbo.Products p
ON p.ProductID = pv.ProductID
INNER JOIN dbo.Categories c
ON c.CategoryID = p.CategoryID
),
CategoryCounts AS
(
SELECT
TrafficSource,
CategoryID,
CategoryName,
COUNT(*) AS SessionsViewingCategory
FROM SessionCategories
GROUP BY
TrafficSource,
CategoryID,
CategoryName
),
SourceTotals AS
(
SELECT
TrafficSource,
COUNT(*) AS TotalSessions
FROM TargetSessions
GROUP BY TrafficSource
),
CategoryRates AS
(
SELECT
cc.CategoryID,
cc.CategoryName,
cc.TrafficSource,
100.0 * cc.SessionsViewingCategory
/ NULLIF(st.TotalSessions, 0) AS CategoryReachPercent
FROM CategoryCounts cc
INNER JOIN SourceTotals st
ON cc.TrafficSource = st.TrafficSource
),
Comparison AS
(
SELECT
CategoryID,
CategoryName,
MAX(CASE
WHEN TrafficSource = ‘Email’
THEN CategoryReachPercent
END) AS EmailReachPercent,
MAX(CASE
WHEN TrafficSource = ‘Organic’
THEN CategoryReachPercent
END) AS OrganicReachPercent
FROM CategoryRates
GROUP BY
CategoryID,
CategoryName
)
SELECT
CategoryID,
CategoryName,
CAST(EmailReachPercent AS DECIMAL(6,2))
AS EmailReachPercent,
CAST(OrganicReachPercent AS DECIMAL(6,2))
AS OrganicReachPercent,
CAST(
EmailReachPercent – OrganicReachPercent
AS DECIMAL(6,2)
) AS DifferencePP
FROM Comparison
ORDER BY
DifferencePP DESC;
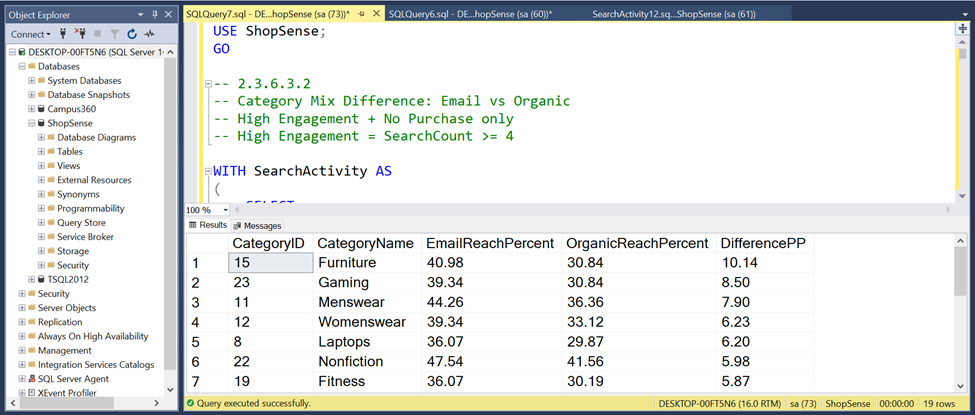
From the visible portion of the output, an important pattern has emerged: unlike the first three Categories, which showed only small differences, some Categories are substantially more represented in Email than in Organic. The largest visible positive differences are Furniture +10.14pp, Gaming +8.50pp, Menswear +7.90pp, Womenswear +6.23pp, Laptops +6.20pp, Nonfiction +5.98pp, and Fitness +5.87pp.
However, we still cannot conclude that these differences explain the lower Cart Progression Rate for Email. The key question is:
Do the Categories that are more heavily represented in Email than in Organic have lower Cart Progression Rates themselves?
2.3.6.3.3 — Cart Progression Rate by Category.
USE ShopSense;
GO
— 2.3.6.3.3
— Cart Progression Rate by Category
— High Engagement + No Purchase only
— Email + Organic
— High Engagement = SearchCount >= 4
WITH SearchActivity AS
(
SELECT
SessionID,
COUNT(*) AS SearchCount
FROM dbo.Searches
GROUP BY SessionID
),
TargetSessions AS
(
SELECT
s.SessionID,
s.TrafficSource
FROM dbo.Sessions s
INNER JOIN SearchActivity sa
ON s.SessionID = sa.SessionID
WHERE
sa.SearchCount >= 4
AND s.TrafficSource IN (‘Email’, ‘Organic’)
AND NOT EXISTS
(
SELECT 1
FROM dbo.Orders o
WHERE o.SessionID = s.SessionID
)
),
SessionCategories AS
(
SELECT DISTINCT
ts.SessionID,
c.CategoryID,
c.CategoryName
FROM TargetSessions ts
INNER JOIN dbo.ProductViews pv
ON pv.SessionID = ts.SessionID
INNER JOIN dbo.Products p
ON p.ProductID = pv.ProductID
INNER JOIN dbo.Categories c
ON c.CategoryID = p.CategoryID
),
CartSessions AS
(
SELECT DISTINCT
SessionID
FROM dbo.CartEvents
WHERE EventType = ‘Add’
)
SELECT
sc.CategoryID,
sc.CategoryName,
COUNT(*) AS SessionsViewingCategory,
SUM(
CASE
WHEN cs.SessionID IS NOT NULL THEN 1
ELSE 0
END
) AS ReachedCartSessions,
COUNT(*) –
SUM(
CASE
WHEN cs.SessionID IS NOT NULL THEN 1
ELSE 0
END
) AS NoCartSessions,
CAST(
100.0 *
SUM(
CASE
WHEN cs.SessionID IS NOT NULL THEN 1
ELSE 0
END
)
/ NULLIF(COUNT(*), 0)
AS DECIMAL(6,2)
) AS CartProgressionRate
FROM SessionCategories sc
LEFT JOIN CartSessions cs
ON sc.SessionID = cs.SessionID
GROUP BY
sc.CategoryID,
sc.CategoryName
ORDER BY
CartProgressionRate ASC;
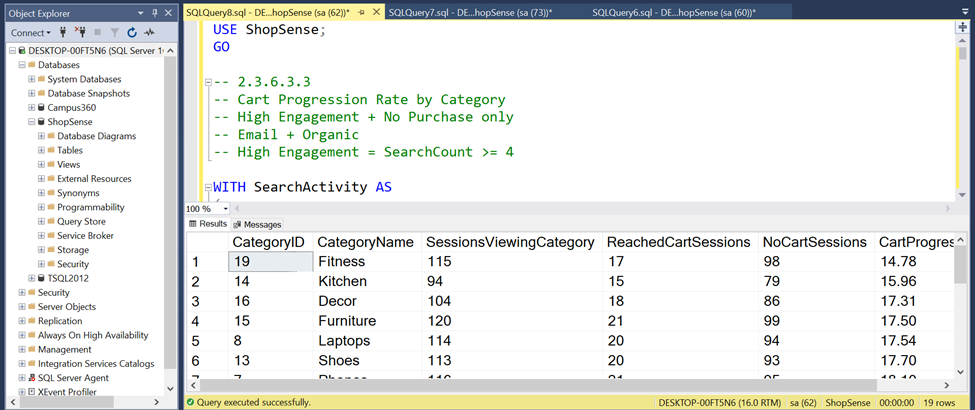
The overall difference between Email and Organic is much larger — Email = 8.20% versus Organic = 20.45%. The fact that Email users are somewhat more concentrated in lower-performing Categories does not necessarily explain the full 12.26 percentage-point gap in Cart Progression.
2.3.6.3.4 — Email vs Organic Cart Progression within the same Category
USE ShopSense;
GO
— 2.3.6.3.4
— Cart Progression by Category × Traffic Source
— High Engagement + No Purchase only
— Email vs Organic
— High Engagement = SearchCount >= 4
WITH SearchActivity AS
(
SELECT
SessionID,
COUNT(*) AS SearchCount
FROM dbo.Searches
GROUP BY SessionID
),
TargetSessions AS
(
SELECT
s.SessionID,
s.TrafficSource
FROM dbo.Sessions s
INNER JOIN SearchActivity sa
ON s.SessionID = sa.SessionID
WHERE
sa.SearchCount >= 4
AND s.TrafficSource IN (‘Email’, ‘Organic’)
AND NOT EXISTS
(
SELECT 1
FROM dbo.Orders o
WHERE o.SessionID = s.SessionID
)
),
SessionCategories AS
(
SELECT DISTINCT
ts.SessionID,
ts.TrafficSource,
c.CategoryID,
c.CategoryName
FROM TargetSessions ts
INNER JOIN dbo.ProductViews pv
ON pv.SessionID = ts.SessionID
INNER JOIN dbo.Products p
ON p.ProductID = pv.ProductID
INNER JOIN dbo.Categories c
ON c.CategoryID = p.CategoryID
),
CartSessions AS
(
SELECT DISTINCT
SessionID
FROM dbo.CartEvents
WHERE EventType = ‘Add’
),
CategoryRates AS
(
SELECT
sc.CategoryID,
sc.CategoryName,
sc.TrafficSource,
COUNT(*) AS SessionsViewingCategory,
SUM(
CASE
WHEN cs.SessionID IS NOT NULL THEN 1
ELSE 0
END
) AS ReachedCartSessions,
CAST(
100.0 *
SUM(
CASE
WHEN cs.SessionID IS NOT NULL THEN 1
ELSE 0
END
)
/ NULLIF(COUNT(*), 0)
AS DECIMAL(6,2)
) AS CartProgressionRate
FROM SessionCategories sc
LEFT JOIN CartSessions cs
ON sc.SessionID = cs.SessionID
GROUP BY
sc.CategoryID,
sc.CategoryName,
sc.TrafficSource
)
SELECT
CategoryID,
CategoryName,
MAX(CASE
WHEN TrafficSource = ‘Email’
THEN SessionsViewingCategory
END) AS EmailSessions,
MAX(CASE
WHEN TrafficSource = ‘Organic’
THEN SessionsViewingCategory
END) AS OrganicSessions,
MAX(CASE
WHEN TrafficSource = ‘Email’
THEN CartProgressionRate
END) AS EmailCartProgression,
MAX(CASE
WHEN TrafficSource = ‘Organic’
THEN CartProgressionRate
END) AS OrganicCartProgression,
CAST(
MAX(CASE
WHEN TrafficSource = ‘Email’
THEN CartProgressionRate
END)
–
MAX(CASE
WHEN TrafficSource = ‘Organic’
THEN CartProgressionRate
END)
AS DECIMAL(6,2)
) AS DifferencePP
FROM CategoryRates
GROUP BY
CategoryID,
CategoryName
ORDER BY
DifferencePP ASC;
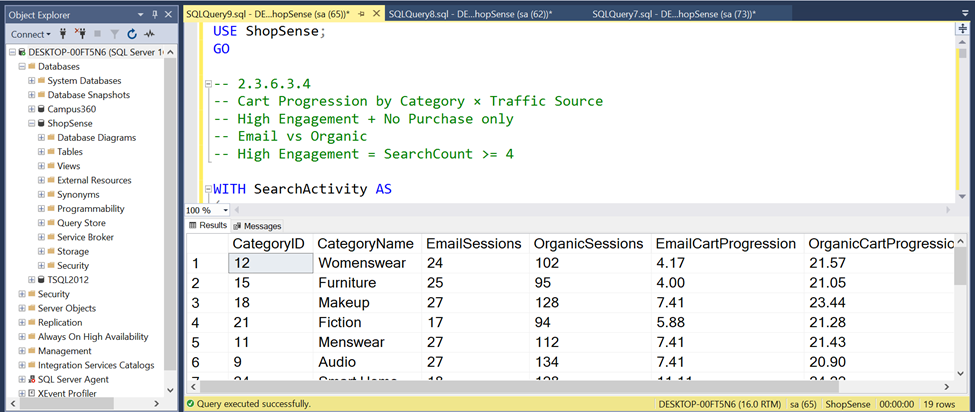
Category Mix does not appear to be the primary driver of Email’s lower Cart Progression. Although Email traffic is more concentrated in several categories with relatively weaker cart progression, the Email–Organic gap persists within the same product categories. Across all 19 categories, Email sessions show lower Cart Progression than Organic sessions. This indicates that the overall 12.26 percentage-point gap is not explained simply by differences in the categories users browse. The evidence points toward a broader Email-specific post-discovery friction or traffic-quality effect.
Device Mix → Does not appear to be the primary explanation
Search/Product Discovery Engagement → Email users are not less engaged
Category Mix → Does not explain the observed difference
2.3.6.4 —Funnel Drop-off Diagnosis
Where Does Email Actually Drop Off?
So far, we have established that the difference between Email and Organic cannot be explained by Device Mix, Search/Product Discovery Engagement, or Category Mix. Therefore, the next step is to determine exactly where in the user journey Email begins to diverge from Organic.
2.3.6.4.1 — Product View → Cart
Among highly engaged non-purchasing users who actually viewed products, are Email users less likely than Organic users to add a product to cart?
USE ShopSense;
GO
— 2.3.6.4.1
— Product View -> Cart Progression
— Email vs Organic
— High Engagement + No Purchase only
— High Engagement = SearchCount >= 4
WITH SearchActivity AS
(
SELECT
SessionID,
COUNT(*) AS SearchCount
FROM dbo.Searches
GROUP BY SessionID
),
HighEngagementNoPurchase AS
(
SELECT
s.SessionID,
s.TrafficSource
FROM dbo.Sessions s
INNER JOIN SearchActivity sa
ON s.SessionID = sa.SessionID
WHERE sa.SearchCount >= 4
AND s.TrafficSource IN (‘Email’, ‘Organic’)
AND NOT EXISTS
(
SELECT 1
FROM dbo.Orders o
WHERE o.SessionID = s.SessionID
)
),
ProductViewSessions AS
(
SELECT DISTINCT
h.SessionID,
h.TrafficSource
FROM HighEngagementNoPurchase h
INNER JOIN dbo.ProductViews pv
ON h.SessionID = pv.SessionID
),
CartSessions AS
(
SELECT DISTINCT
pvs.SessionID,
pvs.TrafficSource
FROM ProductViewSessions pvs
INNER JOIN dbo.CartEvents ce
ON pvs.SessionID = ce.SessionID
WHERE ce.EventType = ‘Add’
)
SELECT
pvs.TrafficSource,
COUNT(*) AS ProductViewSessions,
COUNT(cs.SessionID) AS ReachedCartSessions,
COUNT(*) – COUNT(cs.SessionID) AS DroppedBeforeCart,
CAST(
100.0 * COUNT(cs.SessionID)
/ NULLIF(COUNT(*), 0)
AS DECIMAL(6,2)
) AS ProductViewToCartRate
FROM ProductViewSessions pvs
LEFT JOIN CartSessions cs
ON pvs.SessionID = cs.SessionID
AND pvs.TrafficSource = cs.TrafficSource
GROUP BY
pvs.TrafficSource
ORDER BY
pvs.TrafficSource;
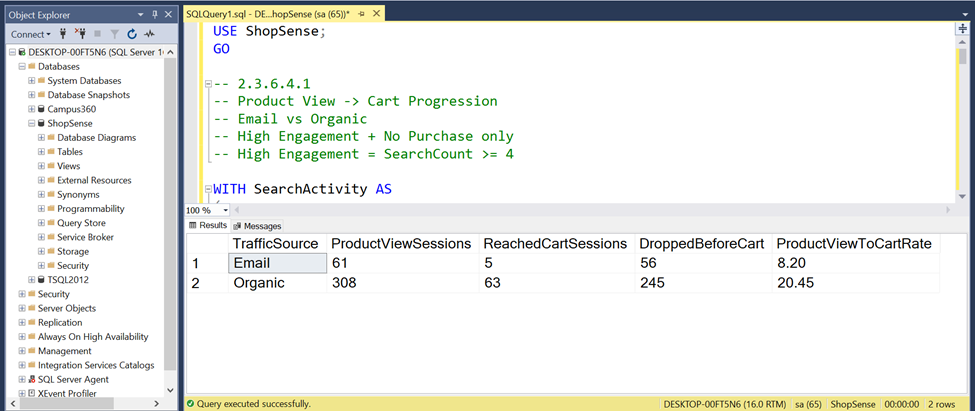
The strongest divergence appears at the Product View → Cart transition. Among high-engagement, non-purchasing sessions that reached a product page, only 8.20% of Email sessions progressed to cart, compared with 20.45% of Organic sessions—a 12.25 percentage-point gap. Since Email users showed comparable or slightly higher search, click, and product-view activity earlier in the journey, the evidence suggests that the primary friction emerges after product discovery, when users must translate browsing engagement into purchase intent.
2.3.6.4.2 — Cart → Checkout Started
Among users who actually Added to Cart, does Email still show a higher drop-off rate than Organic?
USE ShopSense;
GO
— 2.3.6.4.2
— Cart -> Checkout Started
— Email vs Organic
— High Engagement + No Purchase only
— High Engagement = SearchCount >= 4
WITH SearchActivity AS
(
SELECT
SessionID,
COUNT(*) AS SearchCount
FROM dbo.Searches
GROUP BY SessionID
),
HighEngagementNoPurchase AS
(
SELECT
s.SessionID,
s.TrafficSource
FROM dbo.Sessions s
INNER JOIN SearchActivity sa
ON s.SessionID = sa.SessionID
WHERE sa.SearchCount >= 4
AND s.TrafficSource IN (‘Email’, ‘Organic’)
AND NOT EXISTS
(
SELECT 1
FROM dbo.Orders o
WHERE o.SessionID = s.SessionID
)
),
CartSessions AS
(
SELECT DISTINCT
h.SessionID,
h.TrafficSource
FROM HighEngagementNoPurchase h
INNER JOIN dbo.CartEvents ce
ON h.SessionID = ce.SessionID
WHERE ce.EventType = ‘Add’
),
CheckoutStartedSessions AS
(
SELECT DISTINCT
cs.SessionID,
cs.TrafficSource
FROM CartSessions cs
INNER JOIN dbo.CheckoutEvents che
ON cs.SessionID = che.SessionID
WHERE che.EventType = ‘Started’
)
SELECT
cs.TrafficSource,
COUNT(*) AS CartSessions,
COUNT(chs.SessionID) AS CheckoutStartedSessions,
COUNT(*) – COUNT(chs.SessionID)
AS DroppedBeforeCheckout,
CAST(
100.0 * COUNT(chs.SessionID)
/ NULLIF(COUNT(*), 0)
AS DECIMAL(6,2)
) AS CartToCheckoutRate
FROM CartSessions cs
LEFT JOIN CheckoutStartedSessions chs
ON cs.SessionID = chs.SessionID
AND cs.TrafficSource = chs.TrafficSource
GROUP BY
cs.TrafficSource
ORDER BY
cs.TrafficSource;
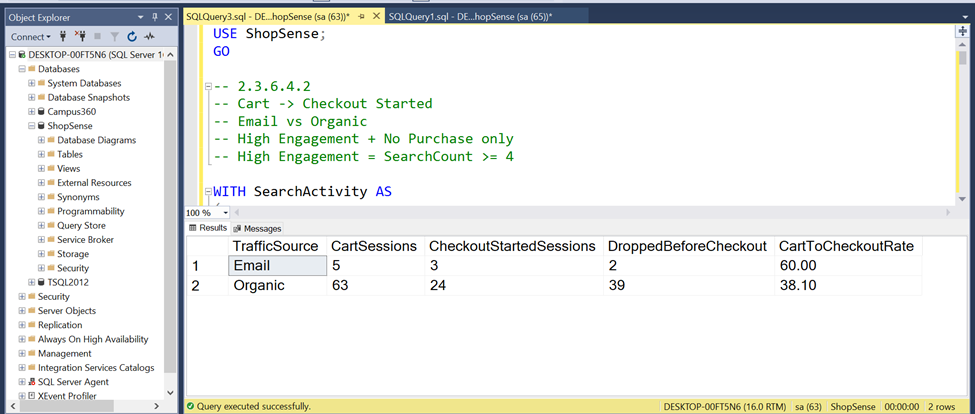
The main Email friction appears before the cart, rather than after it. Email users are highly engaged with search and product discovery, but only 8.20% progress from Product View to Cart compared with 20.45% of Organic users. Among the small subset that does reach the cart, Email does not show an additional deterioration in progression to checkout (60.00% vs. 38.10%). Because only five Email sessions reached the cart, the post-cart comparison should be treated as descriptive rather than conclusive.
2.3.6.4.3 — Checkout Started → Payment
USE ShopSense;
GO
— 2.3.6.4.3
— Checkout Started -> Payment
— Email vs Organic
— High Engagement + No Purchase only
— High Engagement = SearchCount >= 4
WITH SearchActivity AS
(
SELECT
SessionID,
COUNT(*) AS SearchCount
FROM dbo.Searches
GROUP BY SessionID
),
HighEngagementNoPurchase AS
(
SELECT
s.SessionID,
s.TrafficSource
FROM dbo.Sessions s
INNER JOIN SearchActivity sa
ON s.SessionID = sa.SessionID
WHERE sa.SearchCount >= 4
AND s.TrafficSource IN (‘Email’, ‘Organic’)
AND NOT EXISTS
(
SELECT 1
FROM dbo.Orders o
WHERE o.SessionID = s.SessionID
)
),
CheckoutStartedSessions AS
(
SELECT DISTINCT
h.SessionID,
h.TrafficSource
FROM HighEngagementNoPurchase h
INNER JOIN dbo.CheckoutEvents ce
ON h.SessionID = ce.SessionID
WHERE ce.EventType = ‘Started’
),
PaymentSessions AS
(
SELECT DISTINCT
cs.SessionID,
cs.TrafficSource
FROM CheckoutStartedSessions cs
INNER JOIN dbo.CheckoutEvents ce
ON cs.SessionID = ce.SessionID
WHERE ce.EventType = ‘Payment’
)
SELECT
cs.TrafficSource,
COUNT(*) AS CheckoutStartedSessions,
COUNT(ps.SessionID) AS PaymentSessions,
COUNT(*) – COUNT(ps.SessionID)
AS DroppedBeforePayment,
CAST(
100.0 * COUNT(ps.SessionID)
/ NULLIF(COUNT(*), 0)
AS DECIMAL(6,2)
) AS CheckoutToPaymentRate
FROM CheckoutStartedSessions cs
LEFT JOIN PaymentSessions ps
ON cs.SessionID = ps.SessionID
AND cs.TrafficSource = ps.TrafficSource
GROUP BY
cs.TrafficSource
ORDER BY
cs.TrafficSource;
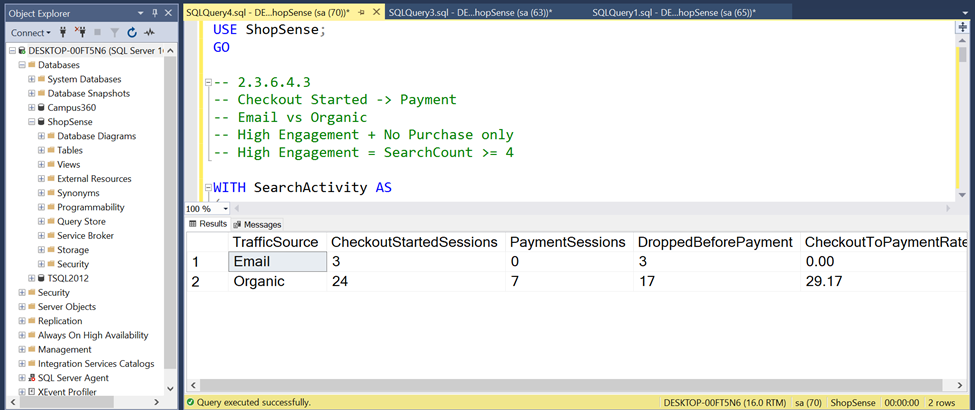
At first glance, this output suggests that Email also experiences a drop-off at the Checkout → Payment stage. However, Email has only 3 observations at this stage. Therefore, we cannot infer from 0/3 that there is a general and statistically established Payment problem for Email. In the report, it is more appropriate to describe this as a secondary signal requiring more data.
At this point, we have identified two areas: stronger evidence of a gap at Product View → Cart (8.20% vs. 20.45%), and a secondary signal at Checkout → Payment (0% vs. 29.17%), which remains highly uncertain due to the very small Email sample size (n = 3).
2.3.6.4.4 — Payment → Completed
USE ShopSense;
GO
— 2.3.6.4.4
— Payment -> Completed
— Email vs Organic
— ALL High-Engagement Sessions
— IMPORTANT: No Purchase filter removed
— High Engagement = SearchCount >= 4
WITH SearchActivity AS
(
SELECT
SessionID,
COUNT(*) AS SearchCount
FROM dbo.Searches
GROUP BY SessionID
),
HighEngagementSessions AS
(
SELECT
s.SessionID,
s.TrafficSource
FROM dbo.Sessions s
INNER JOIN SearchActivity sa
ON s.SessionID = sa.SessionID
WHERE sa.SearchCount >= 4
AND s.TrafficSource IN (‘Email’, ‘Organic’)
),
PaymentSessions AS
(
SELECT DISTINCT
h.SessionID,
h.TrafficSource
FROM HighEngagementSessions h
INNER JOIN dbo.CheckoutEvents ce
ON h.SessionID = ce.SessionID
WHERE ce.EventType = ‘Payment’
),
CompletedSessions AS
(
SELECT DISTINCT
ps.SessionID,
ps.TrafficSource
FROM PaymentSessions ps
INNER JOIN dbo.CheckoutEvents ce
ON ps.SessionID = ce.SessionID
WHERE ce.EventType = ‘Completed’
)
SELECT
ps.TrafficSource,
COUNT(*) AS PaymentSessions,
COUNT(cs.SessionID) AS CompletedSessions,
COUNT(*) – COUNT(cs.SessionID)
AS DroppedAfterPayment,
CAST(
100.0 * COUNT(cs.SessionID)
/ NULLIF(COUNT(*), 0)
AS DECIMAL(6,2)
) AS PaymentToCompletedRate
FROM PaymentSessions ps
LEFT JOIN CompletedSessions cs
ON ps.SessionID = cs.SessionID
AND ps.TrafficSource = cs.TrafficSource
GROUP BY
ps.TrafficSource
ORDER BY
ps.TrafficSource;
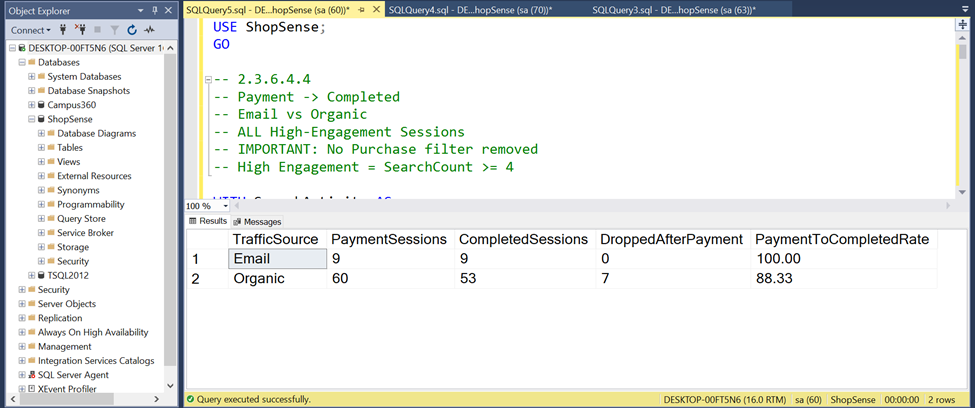
Once Email users actually reach the Payment stage, there is no evidence of further Journey friction: all 9 Sessions progressed to Completed. Therefore, the current evidence points more strongly to a problem higher in the Funnel, particularly at the Product View → Cart stage, rather than at the final Payment stage.
It is also important not to interpret this result as contradictory to the earlier 0/3 finding. Those 3 observations belonged specifically to the High Engagement + No Purchase group, whereas this analysis examines the entire High-Engagement cohort.
2.3.6.4.5 — Full Funnel Comparison
USE ShopSense;
GO
— 2.3.6.4.5
— Full Funnel Comparison
— Email vs Organic
— ALL High-Engagement Sessions
— High Engagement = SearchCount >= 4
WITH SearchActivity AS
(
SELECT
SessionID,
COUNT(*) AS SearchCount
FROM dbo.Searches
GROUP BY SessionID
),
Cohort AS
(
SELECT
s.SessionID,
s.TrafficSource
FROM dbo.Sessions s
INNER JOIN SearchActivity sa
ON s.SessionID = sa.SessionID
WHERE sa.SearchCount >= 4
AND s.TrafficSource IN (‘Email’, ‘Organic’)
),
SessionStages AS
(
SELECT
c.SessionID,
c.TrafficSource,
CASE WHEN EXISTS
(
SELECT 1
FROM dbo.ProductViews pv
WHERE pv.SessionID = c.SessionID
) THEN 1 ELSE 0 END AS ReachedProductView,
CASE WHEN EXISTS
(
SELECT 1
FROM dbo.CartEvents ca
WHERE ca.SessionID = c.SessionID
AND ca.EventType = ‘Add’
) THEN 1 ELSE 0 END AS ReachedCart,
CASE WHEN EXISTS
(
SELECT 1
FROM dbo.CheckoutEvents ce
WHERE ce.SessionID = c.SessionID
AND ce.EventType = ‘Started’
) THEN 1 ELSE 0 END AS ReachedCheckout,
CASE WHEN EXISTS
(
SELECT 1
FROM dbo.CheckoutEvents ce
WHERE ce.SessionID = c.SessionID
AND ce.EventType = ‘Payment’
) THEN 1 ELSE 0 END AS ReachedPayment,
CASE WHEN EXISTS
(
SELECT 1
FROM dbo.CheckoutEvents ce
WHERE ce.SessionID = c.SessionID
AND ce.EventType = ‘Completed’
) THEN 1 ELSE 0 END AS ReachedCompleted
FROM Cohort c
),
FunnelCounts AS
(
SELECT
TrafficSource,
COUNT(*) AS HighEngagementSessions,
SUM(ReachedProductView) AS ProductViewSessions,
SUM(ReachedCart) AS CartSessions,
SUM(ReachedCheckout) AS CheckoutSessions,
SUM(ReachedPayment) AS PaymentSessions,
SUM(ReachedCompleted) AS CompletedSessions
FROM SessionStages
GROUP BY TrafficSource
)
SELECT
TrafficSource,
HighEngagementSessions,
ProductViewSessions,
CartSessions,
CheckoutSessions,
PaymentSessions,
CompletedSessions,
CAST(
100.0 * CartSessions /
NULLIF(ProductViewSessions, 0)
AS DECIMAL(6,2)
) AS ProductViewToCartRate,
CAST(
100.0 * CheckoutSessions /
NULLIF(CartSessions, 0)
AS DECIMAL(6,2)
) AS CartToCheckoutRate,
CAST(
100.0 * PaymentSessions /
NULLIF(CheckoutSessions, 0)
AS DECIMAL(6,2)
) AS CheckoutToPaymentRate,
CAST(
100.0 * CompletedSessions /
NULLIF(PaymentSessions, 0)
AS DECIMAL(6,2)
) AS PaymentToCompletedRate,
CAST(
100.0 * CompletedSessions /
NULLIF(ProductViewSessions, 0)
AS DECIMAL(6,2)
) AS ProductViewToCompletedRate
FROM FunnelCounts
ORDER BY TrafficSource;
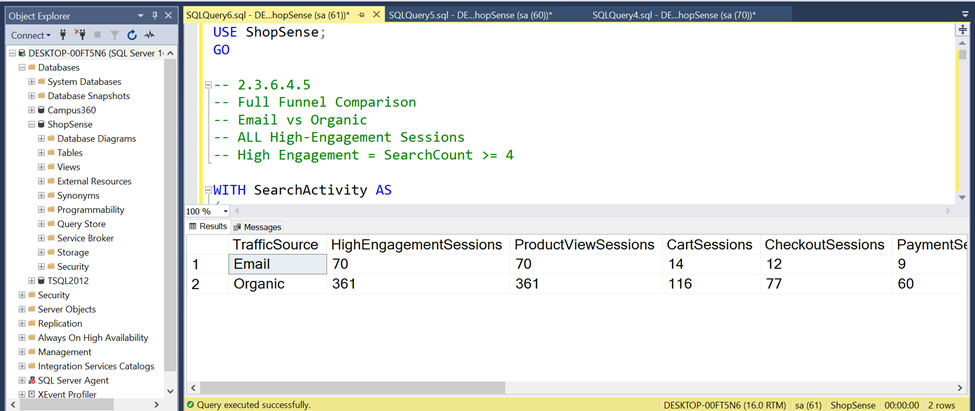
High-engagement Email sessions show their clearest relative friction at the Product View → Cart stage. Once Email users enter the cart, their downstream progression is comparable to or stronger than Organic users in this dataset. This suggests that the primary issue is concentrated earlier in the purchase journey rather than in checkout completion.
2.3.6.5 — Root Cause Validation / Final Diagnosis
So far, we know that the most important Email gap occurs at the Product View → Cart stage:
Email: 20.00% → Organic: 32.13%
Our previous statistical test also provided significant evidence of a difference between the two groups. In Step 2.3.6.5, we now need to investigate what might explain this drop-off by testing the remaining hypotheses one by one.
2.3.6.5.1 — Product-Level Analysis
Let’s examine whether Email users are more likely to view products that inherently have lower Add-to-Cart Rates.
Do Email users disproportionately view products that naturally have lower Add-to-Cart performance?
2.3.6.5.1.1 — Product-Level Add-to-Cart Performance
USE ShopSense;
GO
— 2.3.6.5.1.1
— Product-Level Add-to-Cart Performance
— All High-Engagement Email + Organic Sessions
— High Engagement = SearchCount >= 4
WITH SearchActivity AS
(
SELECT
SessionID,
COUNT(*) AS SearchCount
FROM dbo.Searches
GROUP BY SessionID
),
Cohort AS
(
SELECT
s.SessionID,
s.TrafficSource
FROM dbo.Sessions s
INNER JOIN SearchActivity sa
ON s.SessionID = sa.SessionID
WHERE sa.SearchCount >= 4
AND s.TrafficSource IN (‘Email’, ‘Organic’)
),
SessionProductsViewed AS
(
SELECT DISTINCT
c.SessionID,
c.TrafficSource,
pv.ProductID
FROM Cohort c
INNER JOIN dbo.ProductViews pv
ON c.SessionID = pv.SessionID
),
SessionProductsAdded AS
(
SELECT DISTINCT
c.SessionID,
ce.ProductID
FROM Cohort c
INNER JOIN dbo.CartEvents ce
ON c.SessionID = ce.SessionID
WHERE ce.EventType = ‘Add’
),
ProductPerformance AS
(
SELECT
spv.ProductID,
COUNT(*) AS ViewingSessions,
SUM(
CASE
WHEN spa.ProductID IS NOT NULL THEN 1
ELSE 0
END
) AS AddToCartSessions
FROM SessionProductsViewed spv
LEFT JOIN SessionProductsAdded spa
ON spv.SessionID = spa.SessionID
AND spv.ProductID = spa.ProductID
GROUP BY spv.ProductID
)
SELECT
pp.ProductID,
p.ProductName,
pp.ViewingSessions,
pp.AddToCartSessions,
CAST(
100.0 * pp.AddToCartSessions
/ NULLIF(pp.ViewingSessions, 0)
AS DECIMAL(6,2)
) AS ProductAddToCartRate
FROM ProductPerformance pp
INNER JOIN dbo.Products p
ON pp.ProductID = p.ProductID
ORDER BY
ProductAddToCartRate ASC,
ViewingSessions DESC;
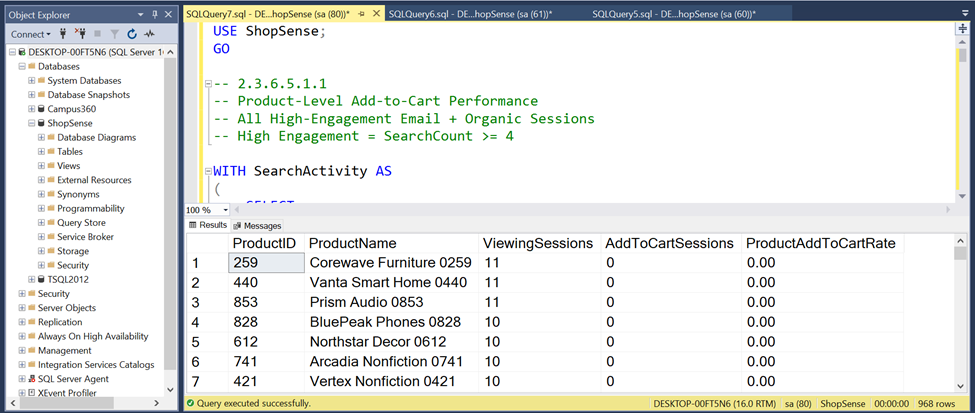
At the top of the output, several products have a Product Add-to-Cart Rate of 0%. For example, Corewave Furniture 0259, Vanta Smart Home 0440, and Prism Audio 0853 were each viewed in 11 Sessions, yet none resulted in an Add-to-Cart event.
However, we still cannot conclude that these products are responsible for Email’s weaker performance. This output only demonstrates that product-level conversion performance is heterogeneous. The key question is whether Email users are disproportionately exposed to these lower-converting products compared with Organic users.
2.3.6.5.1.2 — Exposure to Low-ATC Products: Email vs Organic
USE ShopSense;
GO
— 2.3.6.5.1.2
— Product Performance Exposure by Traffic Source
— Are Email users disproportionately viewing low-ATC products?
— ALL High-Engagement Sessions
— High Engagement = SearchCount >= 4
WITH SearchActivity AS
(
SELECT
SessionID,
COUNT(*) AS SearchCount
FROM dbo.Searches
GROUP BY SessionID
),
Cohort AS
(
SELECT
s.SessionID,
s.TrafficSource
FROM dbo.Sessions s
INNER JOIN SearchActivity sa
ON s.SessionID = sa.SessionID
WHERE sa.SearchCount >= 4
AND s.TrafficSource IN (‘Email’, ‘Organic’)
),
SessionProductsViewed AS
(
SELECT DISTINCT
c.SessionID,
c.TrafficSource,
pv.ProductID
FROM Cohort c
INNER JOIN dbo.ProductViews pv
ON c.SessionID = pv.SessionID
),
SessionProductsAdded AS
(
SELECT DISTINCT
c.SessionID,
ce.ProductID
FROM Cohort c
INNER JOIN dbo.CartEvents ce
ON c.SessionID = ce.SessionID
WHERE ce.EventType = ‘Add’
),
ProductPerformance AS
(
SELECT
spv.ProductID,
COUNT(*) AS ViewingSessions,
SUM(
CASE
WHEN spa.ProductID IS NOT NULL THEN 1
ELSE 0
END
) AS AddToCartSessions,
100.0 *
SUM(
CASE
WHEN spa.ProductID IS NOT NULL THEN 1
ELSE 0
END
)
/ NULLIF(COUNT(*), 0) AS ProductAddToCartRate
FROM SessionProductsViewed spv
LEFT JOIN SessionProductsAdded spa
ON spv.SessionID = spa.SessionID
AND spv.ProductID = spa.ProductID
GROUP BY spv.ProductID
),
ProductQuartiles AS
(
SELECT
ProductID,
ProductAddToCartRate,
NTILE(4) OVER
(
ORDER BY ProductAddToCartRate
) AS PerformanceQuartile
FROM ProductPerformance
),
Exposure AS
(
SELECT
spv.TrafficSource,
pq.PerformanceQuartile,
COUNT(*) AS ProductExposureSessions
FROM SessionProductsViewed spv
INNER JOIN ProductQuartiles pq
ON spv.ProductID = pq.ProductID
GROUP BY
spv.TrafficSource,
pq.PerformanceQuartile
),
TrafficTotals AS
(
SELECT
TrafficSource,
SUM(ProductExposureSessions) AS TotalProductExposureSessions
FROM Exposure
GROUP BY TrafficSource
)
SELECT
e.TrafficSource,
CASE e.PerformanceQuartile
WHEN 1 THEN ‘Q1 – Lowest ATC’
WHEN 2 THEN ‘Q2 – Low-Mid ATC’
WHEN 3 THEN ‘Q3 – High-Mid ATC’
WHEN 4 THEN ‘Q4 – Highest ATC’
END AS ProductPerformanceGroup,
e.ProductExposureSessions,
CAST(
100.0 * e.ProductExposureSessions
/ NULLIF(t.TotalProductExposureSessions, 0)
AS DECIMAL(6,2)
) AS ExposureSharePercent
FROM Exposure e
INNER JOIN TrafficTotals t
ON e.TrafficSource = t.TrafficSource
ORDER BY
e.PerformanceQuartile,
e.TrafficSource;
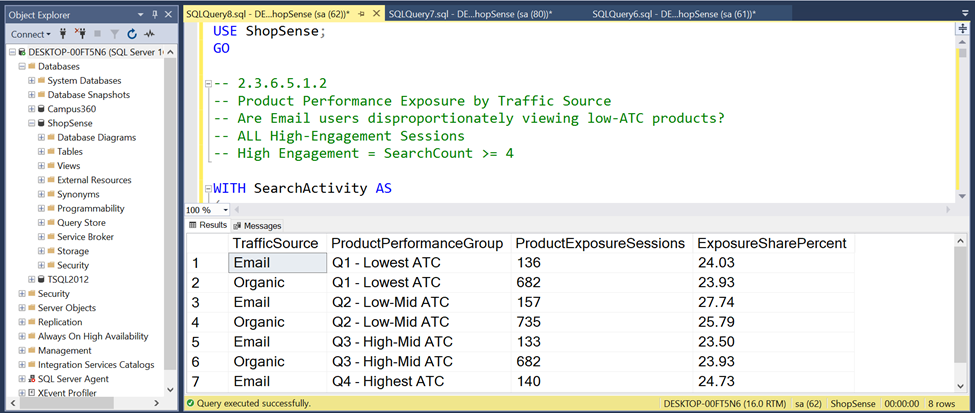
Product-mix differences do not appear to be the primary explanation for Email’s lower Product View → Cart progression. Email and Organic users were exposed to very similar distributions of product performance. Exposure to the lowest-ATC quartile was nearly identical (24.03% vs. 23.93%), while exposure to the lower-performing half of products differed by only about 2 percentage points. This suggests that Email’s 12.13 percentage-point Product View → Cart gap is unlikely to be driven primarily by greater exposure to inherently low-converting products.
2.3.6.5.1.3 — Same-Product Comparison
When Email and Organic users view the same products, do Email users still add them to cart at a lower rate?
USE ShopSense;
GO
— 2.3.6.5.1.3
— Same-Product Add-to-Cart Comparison
— Email vs Organic
— ALL High-Engagement Sessions
— High Engagement = SearchCount >= 4
WITH SearchActivity AS
(
SELECT
SessionID,
COUNT(*) AS SearchCount
FROM dbo.Searches
GROUP BY SessionID
),
Cohort AS
(
SELECT
s.SessionID,
s.TrafficSource
FROM dbo.Sessions s
INNER JOIN SearchActivity sa
ON s.SessionID = sa.SessionID
WHERE sa.SearchCount >= 4
AND s.TrafficSource IN (‘Email’, ‘Organic’)
),
SessionProductsViewed AS
(
SELECT DISTINCT
c.SessionID,
c.TrafficSource,
pv.ProductID
FROM Cohort c
INNER JOIN dbo.ProductViews pv
ON c.SessionID = pv.SessionID
),
SessionProductsAdded AS
(
SELECT DISTINCT
c.SessionID,
c.TrafficSource,
ce.ProductID
FROM Cohort c
INNER JOIN dbo.CartEvents ce
ON c.SessionID = ce.SessionID
WHERE ce.EventType = ‘Add’
),
ProductSourcePerformance AS
(
SELECT
spv.ProductID,
spv.TrafficSource,
COUNT(*) AS ViewingSessions,
SUM(
CASE
WHEN spa.ProductID IS NOT NULL THEN 1
ELSE 0
END
) AS AddToCartSessions
FROM SessionProductsViewed spv
LEFT JOIN SessionProductsAdded spa
ON spv.SessionID = spa.SessionID
AND spv.ProductID = spa.ProductID
AND spv.TrafficSource = spa.TrafficSource
GROUP BY
spv.ProductID,
spv.TrafficSource
),
ProductComparison AS
(
SELECT
ProductID,
MAX(CASE WHEN TrafficSource = ‘Email’
THEN ViewingSessions END) AS EmailViewingSessions,
MAX(CASE WHEN TrafficSource = ‘Email’
THEN AddToCartSessions END) AS EmailAddToCartSessions,
MAX(CASE WHEN TrafficSource = ‘Organic’
THEN ViewingSessions END) AS OrganicViewingSessions,
MAX(CASE WHEN TrafficSource = ‘Organic’
THEN AddToCartSessions END) AS OrganicAddToCartSessions
FROM ProductSourcePerformance
GROUP BY ProductID
),
EligibleProducts AS
(
SELECT *
FROM ProductComparison
WHERE EmailViewingSessions >= 5
AND OrganicViewingSessions >= 5
)
SELECT
COUNT(*) AS ComparableProducts,
SUM(
CASE
WHEN
1.0 * EmailAddToCartSessions
/ NULLIF(EmailViewingSessions, 0)
<
1.0 * OrganicAddToCartSessions
/ NULLIF(OrganicViewingSessions, 0)
THEN 1 ELSE 0
END
) AS ProductsWhereEmailLower,
SUM(
CASE
WHEN
1.0 * EmailAddToCartSessions
/ NULLIF(EmailViewingSessions, 0)
>
1.0 * OrganicAddToCartSessions
/ NULLIF(OrganicViewingSessions, 0)
THEN 1 ELSE 0
END
) AS ProductsWhereEmailHigher,
SUM(
CASE
WHEN
1.0 * EmailAddToCartSessions
/ NULLIF(EmailViewingSessions, 0)
=
1.0 * OrganicAddToCartSessions
/ NULLIF(OrganicViewingSessions, 0)
THEN 1 ELSE 0
END
) AS ProductsWithEqualRate
FROM EligibleProducts;
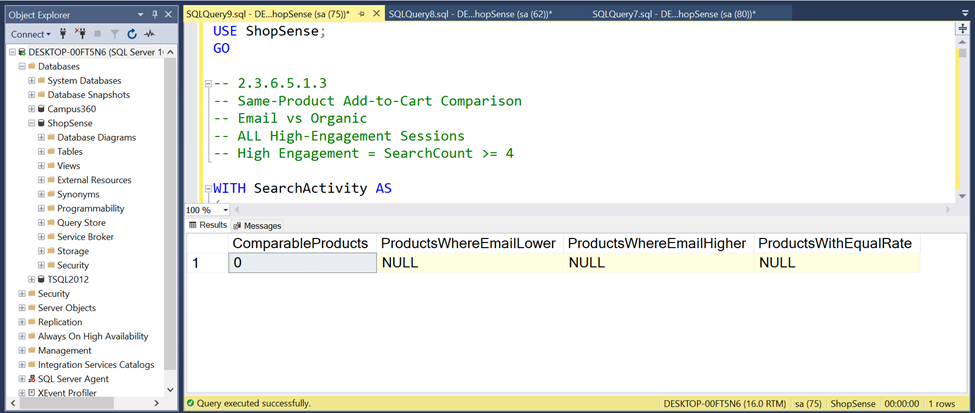
This output is very important because it shows that the previous threshold was too restrictive for our dataset.
2.3.6.5.1.3 — Interpretation
The output shows:
ComparableProducts = 0
This means that there are no products with at least 5 Email Viewing Sessions and 5 Organic Viewing Sessions simultaneously.
This does not mean that there are no shared products between Email and Organic. Rather, because the Email cohort is much smaller only 70 High-Engagement Email Sessions compared with 361 Organic Sessions the data becomes highly sparse at the Product level, and the >= 5 threshold eliminates all products from the comparison.
Therefore, we should not conclude from this query that a Same-Product comparison is impossible. First, we need to determine how much actual Product overlap exists between Email and Organic.
2.3.6.5.1.3A — Product Overlap Diagnostic
USE ShopSense;
GO
— 2.3.6.5.1.3A
— Product Overlap Diagnostic
— Email vs Organic
— ALL High-Engagement Sessions
WITH SearchActivity AS
(
SELECT
SessionID,
COUNT(*) AS SearchCount
FROM dbo.Searches
GROUP BY SessionID
),
Cohort AS
(
SELECT
s.SessionID,
s.TrafficSource
FROM dbo.Sessions s
INNER JOIN SearchActivity sa
ON s.SessionID = sa.SessionID
WHERE sa.SearchCount >= 4
AND s.TrafficSource IN (‘Email’, ‘Organic’)
),
ProductExposure AS
(
SELECT DISTINCT
c.SessionID,
c.TrafficSource,
pv.ProductID
FROM Cohort c
INNER JOIN dbo.ProductViews pv
ON c.SessionID = pv.SessionID
),
ProductCounts AS
(
SELECT
ProductID,
COUNT(DISTINCT CASE
WHEN TrafficSource = ‘Email’
THEN SessionID
END) AS EmailViewingSessions,
COUNT(DISTINCT CASE
WHEN TrafficSource = ‘Organic’
THEN SessionID
END) AS OrganicViewingSessions
FROM ProductExposure
GROUP BY ProductID
)
SELECT
COUNT(*) AS TotalViewedProducts,
SUM(CASE
WHEN EmailViewingSessions > 0
AND OrganicViewingSessions > 0
THEN 1 ELSE 0
END) AS SharedProducts,
SUM(CASE
WHEN EmailViewingSessions >= 2
AND OrganicViewingSessions >= 2
THEN 1 ELSE 0
END) AS SharedProducts_Min2,
SUM(CASE
WHEN EmailViewingSessions >= 3
AND OrganicViewingSessions >= 3
THEN 1 ELSE 0
END) AS SharedProducts_Min3,
SUM(CASE
WHEN EmailViewingSessions >= 5
AND OrganicViewingSessions >= 5
THEN 1 ELSE 0
END) AS SharedProducts_Min5,
MAX(EmailViewingSessions) AS MaxEmailViewsPerProduct,
MAX(OrganicViewingSessions) AS MaxOrganicViewsPerProduct
FROM ProductCounts;
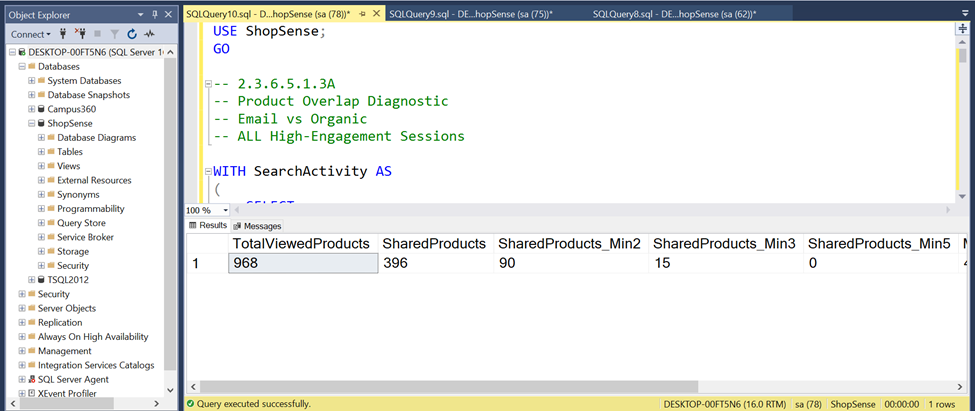
Product exposure distributions were highly similar between Email and Organic traffic, providing little evidence that Email’s lower Product View → Cart progression was primarily driven by exposure to lower-performing products. A direct same-product comparison using a minimum of five viewing sessions per traffic source was not feasible because product-level observations were too sparse.
Out of 968 viewed products, 396 products were viewed at least once by both the Email and Organic groups. This confirms that there is meaningful Product overlap between the two groups. The issue with the previous query was therefore not a lack of overlap, but the limited number of observations at the individual Product level.
With a threshold of 3, only 15 products remain, which is too limited for broad conclusions. However, with a threshold of 2, we retain 90 products. This provides a useful basis for an exploratory directional analysis, provided that individual Product-level rates are not overinterpreted due to the small sample sizes.
2.3.6.5.1.3B — Same-Product Comparison with Min 2 Sessions
USE ShopSense;
GO
— 2.3.6.5.1.3B
— Same-Product Add-to-Cart Comparison
— Minimum 2 Viewing Sessions per Traffic Source
— ALL High-Engagement Sessions
WITH SearchActivity AS
(
SELECT
SessionID,
COUNT(*) AS SearchCount
FROM dbo.Searches
GROUP BY SessionID
),
Cohort AS
(
SELECT
s.SessionID,
s.TrafficSource
FROM dbo.Sessions s
INNER JOIN SearchActivity sa
ON s.SessionID = sa.SessionID
WHERE sa.SearchCount >= 4
AND s.TrafficSource IN (‘Email’, ‘Organic’)
),
SessionProductsViewed AS
(
SELECT DISTINCT
c.SessionID,
c.TrafficSource,
pv.ProductID
FROM Cohort c
INNER JOIN dbo.ProductViews pv
ON c.SessionID = pv.SessionID
),
SessionProductsAdded AS
(
SELECT DISTINCT
c.SessionID,
c.TrafficSource,
ce.ProductID
FROM Cohort c
INNER JOIN dbo.CartEvents ce
ON c.SessionID = ce.SessionID
WHERE ce.EventType = ‘Add’
),
ProductSourcePerformance AS
(
SELECT
spv.ProductID,
spv.TrafficSource,
COUNT(*) AS ViewingSessions,
SUM(
CASE
WHEN spa.ProductID IS NOT NULL THEN 1
ELSE 0
END
) AS AddToCartSessions
FROM SessionProductsViewed spv
LEFT JOIN SessionProductsAdded spa
ON spv.SessionID = spa.SessionID
AND spv.ProductID = spa.ProductID
AND spv.TrafficSource = spa.TrafficSource
GROUP BY
spv.ProductID,
spv.TrafficSource
),
ProductComparison AS
(
SELECT
ProductID,
MAX(CASE WHEN TrafficSource = ‘Email’
THEN ViewingSessions END) AS EmailViewingSessions,
MAX(CASE WHEN TrafficSource = ‘Email’
THEN AddToCartSessions END) AS EmailAddToCartSessions,
MAX(CASE WHEN TrafficSource = ‘Organic’
THEN ViewingSessions END) AS OrganicViewingSessions,
MAX(CASE WHEN TrafficSource = ‘Organic’
THEN AddToCartSessions END) AS OrganicAddToCartSessions
FROM ProductSourcePerformance
GROUP BY ProductID
),
EligibleProducts AS
(
SELECT *
FROM ProductComparison
WHERE EmailViewingSessions >= 2
AND OrganicViewingSessions >= 2
)
SELECT
COUNT(*) AS ComparableProducts,
SUM(CASE
WHEN
1.0 * EmailAddToCartSessions /
NULLIF(EmailViewingSessions, 0)
<
1.0 * OrganicAddToCartSessions /
NULLIF(OrganicViewingSessions, 0)
THEN 1 ELSE 0
END) AS ProductsWhereEmailLower,
SUM(CASE
WHEN
1.0 * EmailAddToCartSessions /
NULLIF(EmailViewingSessions, 0)
>
1.0 * OrganicAddToCartSessions /
NULLIF(OrganicViewingSessions, 0)
THEN 1 ELSE 0
END) AS ProductsWhereEmailHigher,
SUM(CASE
WHEN
1.0 * EmailAddToCartSessions /
NULLIF(EmailViewingSessions, 0)
=
1.0 * OrganicAddToCartSessions /
NULLIF(OrganicViewingSessions, 0)
THEN 1 ELSE 0
END) AS ProductsWithEqualRate
FROM EligibleProducts;
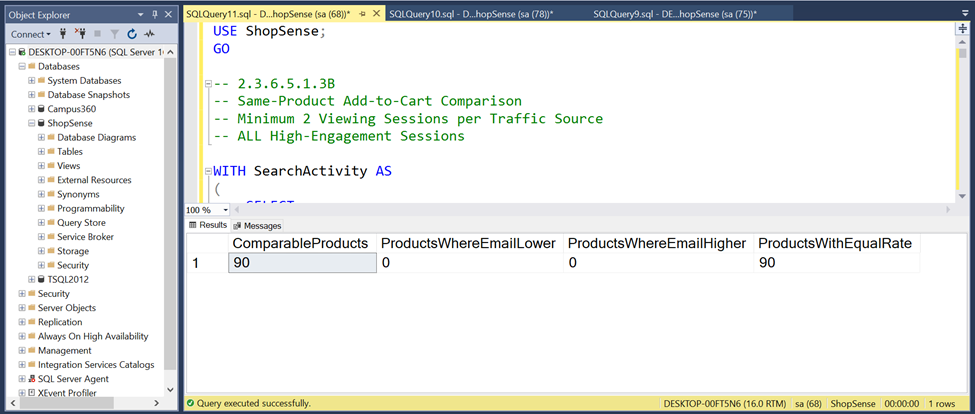
Product mix does not appear to be the primary driver of Email’s lower Product View → Cart progression. Email and Organic users were exposed to very similar distributions of low- and high-performing products, with exposure to the lowest-ATC quartile nearly identical (24.03% vs. 23.93%). Although 396 products were viewed by both traffic sources, product-level observations were too sparse for a reliable same-product conversion comparison. Overall, the available evidence provides little support for product selection or product mix as the main explanation for the Email conversion gap.
2.3.6.5.2 — Price & Discount Analysis
Are high-engagement Email users viewing more expensive products or receiving less attractive discounts than Organic users?
2.3.6.5.2.1 — Average Price & Discount Exposure
USE ShopSense;
GO
— 2.3.6.5.2.1
— Price & Discount Exposure
— Email vs Organic
— ALL High-Engagement Sessions
— High Engagement = SearchCount >= 4
WITH SearchActivity AS
(
SELECT
SessionID,
COUNT(*) AS SearchCount
FROM dbo.Searches
GROUP BY SessionID
),
Cohort AS
(
SELECT
s.SessionID,
s.TrafficSource
FROM dbo.Sessions s
INNER JOIN SearchActivity sa
ON s.SessionID = sa.SessionID
WHERE sa.SearchCount >= 4
AND s.TrafficSource IN (‘Email’, ‘Organic’)
),
SessionProductsViewed AS
(
SELECT DISTINCT
c.SessionID,
c.TrafficSource,
pv.ProductID
FROM Cohort c
INNER JOIN dbo.ProductViews pv
ON c.SessionID = pv.SessionID
),
ProductExposure AS
(
SELECT
spv.SessionID,
spv.TrafficSource,
spv.ProductID,
p.ListPrice,
p.DiscountPercent,
p.ListPrice *
(1 – p.DiscountPercent / 100.0) AS EffectivePrice
FROM SessionProductsViewed spv
INNER JOIN dbo.Products p
ON spv.ProductID = p.ProductID
)
SELECT
TrafficSource,
COUNT(*) AS ProductExposureSessions,
CAST(
AVG(ListPrice)
AS DECIMAL(10,2)
) AS AvgListPrice,
CAST(
AVG(DiscountPercent)
AS DECIMAL(6,2)
) AS AvgDiscountPercent,
CAST(
AVG(EffectivePrice)
AS DECIMAL(10,2)
) AS AvgEffectivePrice,
CAST(
MIN(EffectivePrice)
AS DECIMAL(10,2)
) AS MinEffectivePrice,
CAST(
MAX(EffectivePrice)
AS DECIMAL(10,2)
) AS MaxEffectivePrice
FROM ProductExposure
GROUP BY TrafficSource
ORDER BY TrafficSource;
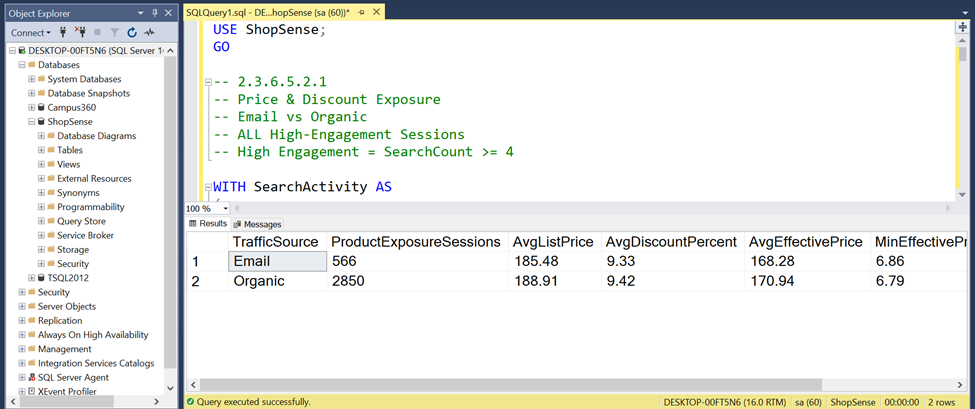
Average price and discount exposure were nearly identical between high-engagement Email and Organic users. Email users viewed slightly lower-priced products on average ($185.48 vs. $188.91 list price), received almost identical discounts (9.33% vs. 9.42%), and had a slightly lower average effective product price ($168.28 vs. $170.94). These results provide little evidence that higher prices or weaker discounts are the primary drivers of Email’s lower Product View → Cart progression.
2.3.6.5.2.2 — Effective Price Distribution
USE ShopSense;
GO
— 2.3.6.5.2.2
— Effective Price Distribution
— Email vs Organic
— ALL High-Engagement Sessions
— High Engagement = SearchCount >= 4
WITH SearchActivity AS
(
SELECT
SessionID,
COUNT(*) AS SearchCount
FROM dbo.Searches
GROUP BY SessionID
),
Cohort AS
(
SELECT
s.SessionID,
s.TrafficSource
FROM dbo.Sessions s
INNER JOIN SearchActivity sa
ON s.SessionID = sa.SessionID
WHERE sa.SearchCount >= 4
AND s.TrafficSource IN (‘Email’, ‘Organic’)
),
SessionProductsViewed AS
(
SELECT DISTINCT
c.SessionID,
c.TrafficSource,
pv.ProductID
FROM Cohort c
INNER JOIN dbo.ProductViews pv
ON c.SessionID = pv.SessionID
),
ProductExposure AS
(
SELECT
spv.SessionID,
spv.TrafficSource,
spv.ProductID,
p.ListPrice *
(1 – p.DiscountPercent / 100.0) AS EffectivePrice
FROM SessionProductsViewed spv
INNER JOIN dbo.Products p
ON spv.ProductID = p.ProductID
),
PriceQuartiles AS
(
SELECT
*,
NTILE(4) OVER
(
ORDER BY EffectivePrice
) AS PriceQuartile
FROM ProductExposure
),
Distribution AS
(
SELECT
TrafficSource,
PriceQuartile,
COUNT(*) AS ProductExposureSessions
FROM PriceQuartiles
GROUP BY
TrafficSource,
PriceQuartile
),
TrafficTotals AS
(
SELECT
TrafficSource,
SUM(ProductExposureSessions) AS TotalExposureSessions
FROM Distribution
GROUP BY TrafficSource
)
SELECT
d.TrafficSource,
CASE d.PriceQuartile
WHEN 1 THEN ‘Q1 – Lowest Price’
WHEN 2 THEN ‘Q2 – Low-Mid Price’
WHEN 3 THEN ‘Q3 – High-Mid Price’
WHEN 4 THEN ‘Q4 – Highest Price’
END AS PriceGroup,
d.ProductExposureSessions,
CAST(
100.0 * d.ProductExposureSessions
/ NULLIF(t.TotalExposureSessions, 0)
AS DECIMAL(6,2)
) AS ExposureSharePercent
FROM Distribution d
INNER JOIN TrafficTotals t
ON d.TrafficSource = t.TrafficSource
ORDER BY
d.PriceQuartile,
d.TrafficSource;
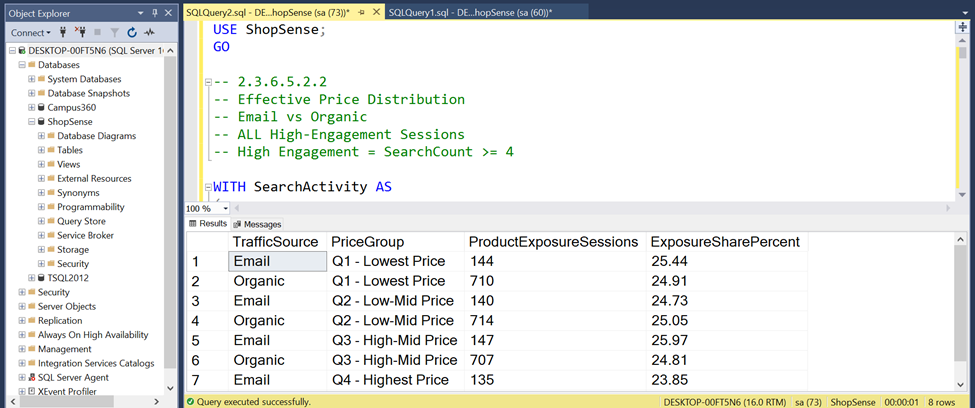
Price and discount differences do not appear to explain Email’s lower Product View → Cart progression. Average effective prices were slightly lower for Email ($168.28 vs. $170.94), average discounts were nearly identical (9.33% vs. 9.42%), and exposure across price quartiles was highly similar. Email users were not disproportionately exposed to the highest-priced products; in fact, their exposure to the highest-price quartile was slightly lower than Organic. Overall, the evidence provides little support for price or discount exposure as the primary source of the Email conversion gap.
2.3.6.5.3 — Product Quality Signals
Are Email users being exposed to products with weaker ratings or fewer reviews, potentially reducing confidence before Add-to-Cart?
2.3.6.5.3.1 — Rating & Review Exposure
USE ShopSense;
GO
— 2.3.6.5.3.1
— Product Quality Signals
— Rating & Review Exposure
— Email vs Organic
— ALL High-Engagement Sessions
— High Engagement = SearchCount >= 4
WITH SearchActivity AS
(
SELECT
SessionID,
COUNT(*) AS SearchCount
FROM dbo.Searches
GROUP BY SessionID
),
Cohort AS
(
SELECT
s.SessionID,
s.TrafficSource
FROM dbo.Sessions s
INNER JOIN SearchActivity sa
ON s.SessionID = sa.SessionID
WHERE sa.SearchCount >= 4
AND s.TrafficSource IN (‘Email’, ‘Organic’)
),
SessionProductsViewed AS
(
SELECT DISTINCT
c.SessionID,
c.TrafficSource,
pv.ProductID
FROM Cohort c
INNER JOIN dbo.ProductViews pv
ON c.SessionID = pv.SessionID
),
QualityExposure AS
(
SELECT
spv.SessionID,
spv.TrafficSource,
spv.ProductID,
p.Rating,
p.ReviewCount
FROM SessionProductsViewed spv
INNER JOIN dbo.Products p
ON spv.ProductID = p.ProductID
)
SELECT
TrafficSource,
COUNT(*) AS ProductExposureSessions,
CAST(
AVG(CAST(Rating AS DECIMAL(10,4)))
AS DECIMAL(6,2)
) AS AvgRating,
CAST(
AVG(CAST(ReviewCount AS DECIMAL(18,2)))
AS DECIMAL(12,2)
) AS AvgReviewCount,
MIN(Rating) AS MinRating,
MAX(Rating) AS MaxRating,
MIN(ReviewCount) AS MinReviewCount,
MAX(ReviewCount) AS MaxReviewCount
FROM QualityExposure
GROUP BY TrafficSource
ORDER BY TrafficSource;
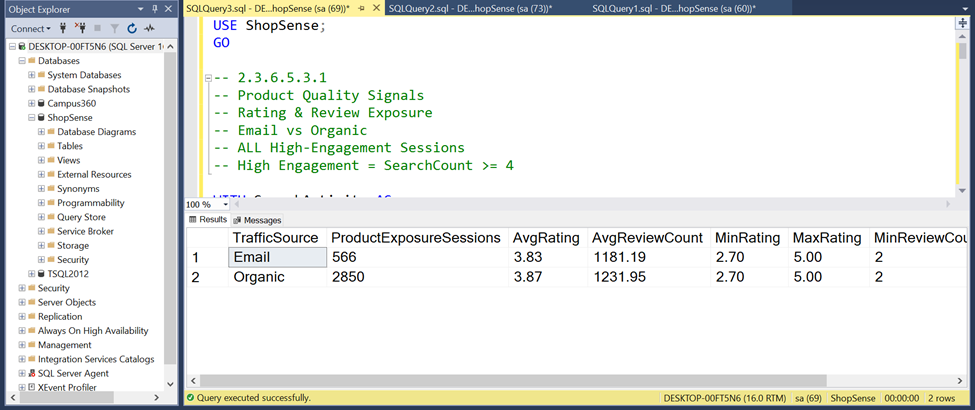
Product quality signals were highly similar between Email and Organic traffic. Email users viewed products with an average rating of 3.83 compared with 3.87 for Organic, while average review counts were 1,181.19 and 1,231.95 respectively. These relatively small differences provide little evidence that weaker product ratings or social proof are the primary drivers of Email’s lower Product View → Cart progression.
2.3.6.5.3.2 — Rating Distribution
USE ShopSense;
GO
— 2.3.6.5.3.2
— Product Rating Distribution
— Email vs Organic
— ALL High-Engagement Sessions
— High Engagement = SearchCount >= 4
WITH SearchActivity AS
(
SELECT
SessionID,
COUNT(*) AS SearchCount
FROM dbo.Searches
GROUP BY SessionID
),
Cohort AS
(
SELECT
s.SessionID,
s.TrafficSource
FROM dbo.Sessions s
INNER JOIN SearchActivity sa
ON s.SessionID = sa.SessionID
WHERE sa.SearchCount >= 4
AND s.TrafficSource IN (‘Email’, ‘Organic’)
),
SessionProductsViewed AS
(
SELECT DISTINCT
c.SessionID,
c.TrafficSource,
pv.ProductID
FROM Cohort c
INNER JOIN dbo.ProductViews pv
ON c.SessionID = pv.SessionID
),
QualityExposure AS
(
SELECT
spv.SessionID,
spv.TrafficSource,
spv.ProductID,
p.Rating
FROM SessionProductsViewed spv
INNER JOIN dbo.Products p
ON spv.ProductID = p.ProductID
),
RatingQuartiles AS
(
SELECT
*,
NTILE(4) OVER
(
ORDER BY Rating
) AS RatingQuartile
FROM QualityExposure
),
Distribution AS
(
SELECT
TrafficSource,
RatingQuartile,
COUNT(*) AS ProductExposureSessions
FROM RatingQuartiles
GROUP BY
TrafficSource,
RatingQuartile
),
TrafficTotals AS
(
SELECT
TrafficSource,
SUM(ProductExposureSessions) AS TotalExposureSessions
FROM Distribution
GROUP BY TrafficSource
)
SELECT
d.TrafficSource,
CASE d.RatingQuartile
WHEN 1 THEN ‘Q1 – Lowest Rating’
WHEN 2 THEN ‘Q2 – Low-Mid Rating’
WHEN 3 THEN ‘Q3 – High-Mid Rating’
WHEN 4 THEN ‘Q4 – Highest Rating’
END AS RatingGroup,
d.ProductExposureSessions,
CAST(
100.0 * d.ProductExposureSessions
/ NULLIF(t.TotalExposureSessions, 0)
AS DECIMAL(6,2)
) AS ExposureSharePercent
FROM Distribution d
INNER JOIN TrafficTotals t
ON d.TrafficSource = t.TrafficSource
ORDER BY
d.RatingQuartile,
d.TrafficSource;
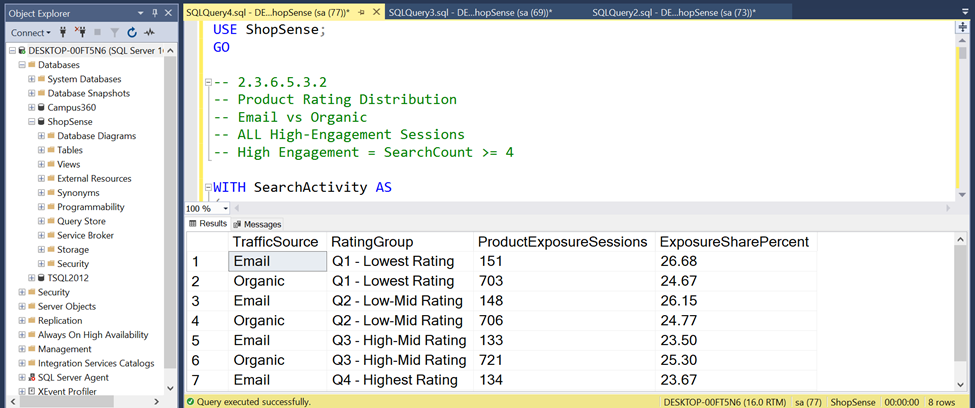
Email users showed slightly greater exposure to lower-rated products, with 52.83% of Email product exposure falling in the lower half of the rating distribution compared with 49.44% for Organic (+3.39 pp). However, average ratings were also very similar (3.83 vs. 3.87). This suggests that product rating may represent a minor compositional difference, but the available evidence does not support it as the primary explanation for the substantially larger Email Product View → Cart gap.
2.3.6.5.3.3 — Review Count Distribution
USE ShopSense;
GO
— 2.3.6.5.3.3
— Review Count Distribution
— Email vs Organic
— ALL High-Engagement Sessions
— High Engagement = SearchCount >= 4
WITH SearchActivity AS
(
SELECT
SessionID,
COUNT(*) AS SearchCount
FROM dbo.Searches
GROUP BY SessionID
),
Cohort AS
(
SELECT
s.SessionID,
s.TrafficSource
FROM dbo.Sessions s
INNER JOIN SearchActivity sa
ON s.SessionID = sa.SessionID
WHERE sa.SearchCount >= 4
AND s.TrafficSource IN (‘Email’, ‘Organic’)
),
SessionProductsViewed AS
(
SELECT DISTINCT
c.SessionID,
c.TrafficSource,
pv.ProductID
FROM Cohort c
INNER JOIN dbo.ProductViews pv
ON c.SessionID = pv.SessionID
),
QualityExposure AS
(
SELECT
spv.SessionID,
spv.TrafficSource,
spv.ProductID,
p.ReviewCount
FROM SessionProductsViewed spv
INNER JOIN dbo.Products p
ON spv.ProductID = p.ProductID
),
ReviewQuartiles AS
(
SELECT
*,
NTILE(4) OVER
(
ORDER BY ReviewCount
) AS ReviewQuartile
FROM QualityExposure
),
Distribution AS
(
SELECT
TrafficSource,
ReviewQuartile,
COUNT(*) AS ProductExposureSessions
FROM ReviewQuartiles
GROUP BY
TrafficSource,
ReviewQuartile
),
TrafficTotals AS
(
SELECT
TrafficSource,
SUM(ProductExposureSessions) AS TotalExposureSessions
FROM Distribution
GROUP BY TrafficSource
)
SELECT
d.TrafficSource,
CASE d.ReviewQuartile
WHEN 1 THEN ‘Q1 – Lowest Review Count’
WHEN 2 THEN ‘Q2 – Low-Mid Review Count’
WHEN 3 THEN ‘Q3 – High-Mid Review Count’
WHEN 4 THEN ‘Q4 – Highest Review Count’
END AS ReviewGroup,
d.ProductExposureSessions,
CAST(
100.0 * d.ProductExposureSessions
/ NULLIF(t.TotalExposureSessions, 0)
AS DECIMAL(6,2)
) AS ExposureSharePercent
FROM Distribution d
INNER JOIN TrafficTotals t
ON d.TrafficSource = t.TrafficSource
ORDER BY
d.ReviewQuartile,
d.TrafficSource;
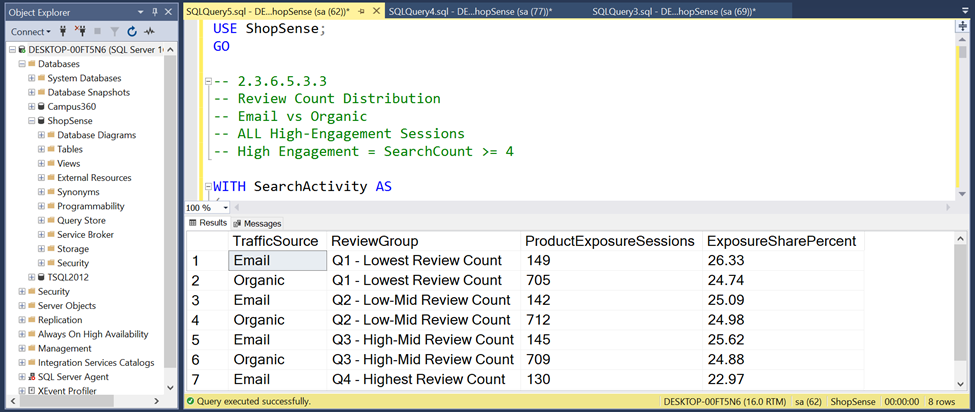
Product quality and social-proof differences appear modest. Email users had slightly greater exposure to lower-rated products and products with fewer reviews, but the differences were relatively small. The lower half of the review-count distribution represented 51.42% of Email exposure versus 49.72% for Organic, while average ratings were 3.83 vs. 3.87. These findings suggest that weaker product quality signals may be a minor contributing factor, but they do not appear sufficient to explain the substantially larger Email Product View → Cart gap.
2.3.6.5.4 — Stock / Availability Analysis
Are Email users viewing products with lower inventory availability, potentially limiting their ability or willingness to add products to cart?
2.3.6.5.4.1 — Stock Exposure: Email vs Organic
USE ShopSense;
GO
— 2.3.6.5.4.1
— Stock / Availability Exposure
— Email vs Organic
— ALL High-Engagement Sessions
— High Engagement = SearchCount >= 4
WITH SearchActivity AS
(
SELECT
SessionID,
COUNT(*) AS SearchCount
FROM dbo.Searches
GROUP BY SessionID
),
Cohort AS
(
SELECT
s.SessionID,
s.TrafficSource
FROM dbo.Sessions s
INNER JOIN SearchActivity sa
ON s.SessionID = sa.SessionID
WHERE sa.SearchCount >= 4
AND s.TrafficSource IN (‘Email’, ‘Organic’)
),
SessionProductsViewed AS
(
SELECT DISTINCT
c.SessionID,
c.TrafficSource,
pv.ProductID
FROM Cohort c
INNER JOIN dbo.ProductViews pv
ON c.SessionID = pv.SessionID
),
StockExposure AS
(
SELECT
spv.SessionID,
spv.TrafficSource,
spv.ProductID,
p.StockQuantity
FROM SessionProductsViewed spv
INNER JOIN dbo.Products p
ON spv.ProductID = p.ProductID
)
SELECT
TrafficSource,
COUNT(*) AS ProductExposureSessions,
CAST(
AVG(CAST(StockQuantity AS DECIMAL(18,2)))
AS DECIMAL(12,2)
) AS AvgStockQuantity,
MIN(StockQuantity) AS MinStockQuantity,
MAX(StockQuantity) AS MaxStockQuantity,
SUM(
CASE WHEN StockQuantity = 0
THEN 1 ELSE 0 END
) AS OutOfStockExposures,
CAST(
100.0 *
SUM(CASE WHEN StockQuantity = 0 THEN 1 ELSE 0 END)
/ NULLIF(COUNT(*), 0)
AS DECIMAL(6,2)
) AS OutOfStockExposurePercent,
SUM(
CASE WHEN StockQuantity BETWEEN 1 AND 10
THEN 1 ELSE 0 END
) AS LowStockExposures,
CAST(
100.0 *
SUM(CASE WHEN StockQuantity BETWEEN 1 AND 10 THEN 1 ELSE 0 END)
/ NULLIF(COUNT(*), 0)
AS DECIMAL(6,2)
) AS LowStockExposurePercent
FROM StockExposure
GROUP BY TrafficSource
ORDER BY TrafficSource;
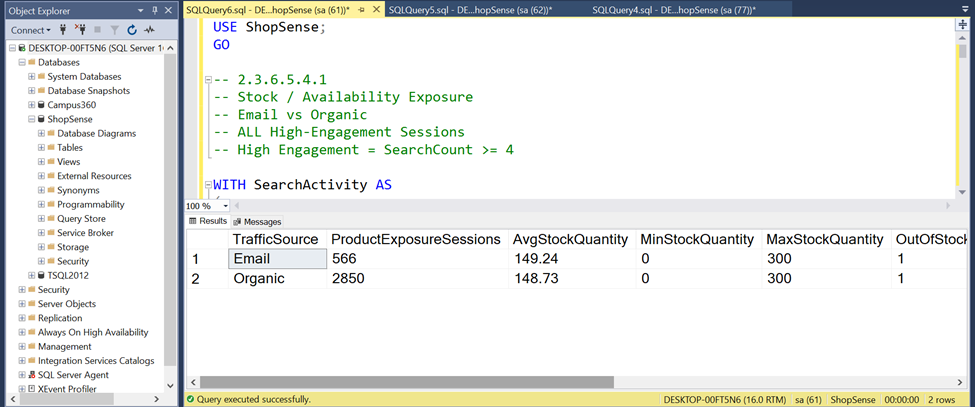
Inventory availability does not appear to explain Email’s lower Product View → Cart progression. Average stock levels were nearly identical for Email and Organic product exposure (149.24 vs. 148.73 units), while out-of-stock exposure was extremely rare in both groups. The available evidence therefore provides little support for stock availability as a primary source of the Email conversion gap.
2.3.6.5.5 — Root Cause Synthesis
| Hypothesis | Evidence | Assessment |
|—|—|—|
| Lower search engagement | Search clicks/views broadly similar | Not Supported |
| Device mix | Email gap observed across key devices | Not Supported as primary driver |
| Category mix | Differences exist, but Email underperforms within many categories | Not Supported as primary driver |
| Product mix | Lowest-ATC exposure 24.03% vs. 23.93% | Not Supported |
| Higher prices | Effective price $168.28 vs. $170.94 | Not Supported |
| Weaker discounts | 9.33% vs. 9.42% | Not Supported |
| Lower ratings | Small directional difference | Possible minor contributor |
| Fewer reviews | Small directional difference | Possible minor contributor |
| Stock availability | Avg stock 149.24 vs. 148.73; OOS extremely rare | Not Supported |
| Checkout/payment friction | Downstream funnel broadly comparable | Not Supported as primary driver |
| Product View → Cart friction | 20.00% vs. 32.13% | Strongest observed signal |
After testing multiple observable explanations—including search engagement, device, category mix, product mix, price, discounts, product quality signals, inventory availability, and downstream checkout behavior—the clearest unresolved difference remained at the Product View → Cart transition. High-engagement Email sessions converted from Product View to Cart at 20.00%, compared with 32.13% for Organic sessions. The available data therefore localizes the primary observed friction to the product-evaluation-to-cart stage, while the underlying causal mechanism cannot be identified from the current dataset alone.
2.3.6.5.6 — Final Business Diagnosis & Recommendations
The root-cause analysis identified the Product View → Cart transition as the clearest friction point for high-engagement Email users. Email sessions progressed from Product View to Cart at 20.00%, compared with 32.13% for Organic sessions, while downstream checkout behavior was broadly comparable once users entered the cart.
Alternative explanations—including search engagement, device mix, category mix, product mix, pricing, discounts, inventory availability, and downstream checkout behavior—did not provide sufficient evidence to explain the gap. Product rating and review exposure showed small directional differences but were not large enough to account for the observed funnel disparity.
The analysis therefore localizes the primary observed friction to the product-evaluation-to-cart stage. However, because the current dataset does not directly measure product-page UX, promotional-message consistency, CTA visibility, shipping communication, or other experience-level factors, the underlying causal mechanism cannot be determined from observational analysis alone.
The recommended next step is a controlled A/B experiment targeting high-engagement Email traffic, testing an enhanced product-page experience designed to improve purchase confidence and the transition from Product View to Add to Cart. The primary experiment metric should be Product View → Add-to-Cart Rate, supported by downstream conversion and revenue guardrails.
2.4 — A/B Testing
2.4.1 — Experiment Design
1. Experiment Objective
Determine whether an enhanced product-page experience can increase the Product View → Add-to-Cart rate among high-engagement Email users.
Can a clearer and more persuasive product-page experience help high-engagement Email users progress from product exploration to Add to Cart?
Traffic Source: Email
High Engagement: SearchCount >= 4
Reached Product View: Yes
Control vs. Treatment:
Control — Variant A
Current Product Page experience.
Treatment — Variant B
More prominent Add-to-Cart CTA
Clearer discount / promotional messaging
More visible delivery and return information
Stronger purchase-confidence signals
Hypotheses
Null Hypothesis (H₀):
The enhanced product-page experience does not increase the Product View → Add-to-Cart rate for high-engagement Email users.
H₀: pTreatment ≤ pControl
Alternative Hypothesis (H₁):
The enhanced product-page experience increases the Product View → Add-to-Cart rate for high-engagement Email users.
H₁: pTreatment > pControl
Experiment Assignment
50% Control (A)
50% → Treatment (B)
Based on the root-cause analysis, an A/B experiment was designed to address the primary observed friction at the Product View → Add-to-Cart stage among high-engagement Email users. Eligible users were randomly assigned to either the existing product-page experience (Control) or an enhanced experience (Treatment) featuring a more prominent Add-to-Cart CTA, clearer promotional messaging, and stronger purchase-confidence information.
The primary experiment metric is Product View → Add-to-Cart Rate, supported by downstream conversion and revenue metrics and appropriate guardrails. The experiment tests whether the enhanced experience produces a measurable improvement in progression from product evaluation to purchase intent.
2.4.2 — A/B Test Analysis
2.4.2.1 — First, Identify the Existing Experiments
Since we have already created and populated the Experiments, ExperimentVariants, and ExperimentAssignments tables, we first need to identify which Experiments and Variants actually exist in the dataset before writing the main SQL query.
USE ShopSense;
GO
— 2.4.2.1
— Experiment & Variant Validation
SELECT
e.ExperimentID,
e.ExperimentName,
e.PrimaryMetric,
e.Status,
e.StartDate,
e.EndDate,
ev.VariantID,
ev.VariantName,
ev.VariantDescription,
ev.AllocationPercent,
COUNT(ea.AssignmentID) AS AssignedObservations
FROM dbo.Experiments e
INNER JOIN dbo.ExperimentVariants ev
ON e.ExperimentID = ev.ExperimentID
LEFT JOIN dbo.ExperimentAssignments ea
ON ev.ExperimentID = ea.ExperimentID
AND ev.VariantID = ea.VariantID
GROUP BY
e.ExperimentID,
e.ExperimentName,
e.PrimaryMetric,
e.Status,
e.StartDate,
e.EndDate,
ev.VariantID,
ev.VariantName,
ev.VariantDescription,
ev.AllocationPercent
ORDER BY
e.ExperimentID,
ev.VariantID;
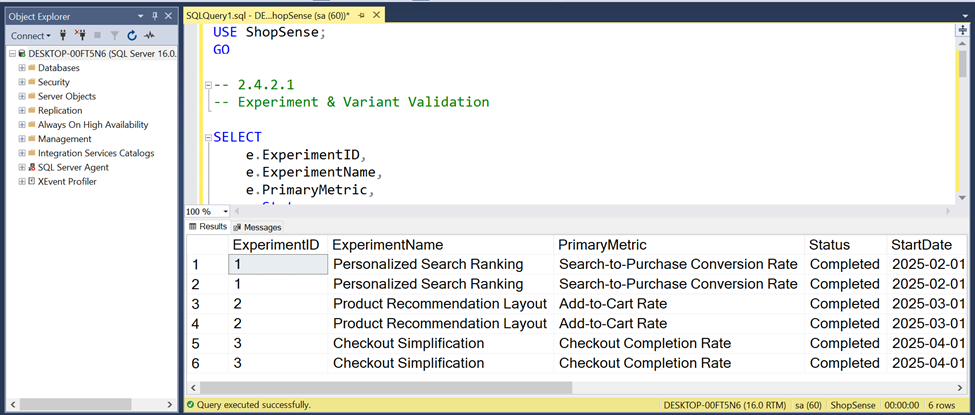
2.4.2.2 — Review Assignments and Variants for Experiment 2
Before calculating the KPIs, we need to determine how many assignments belong to the Control and Treatment groups and whether the experiment assignments were made at the User level or Session level.
USE ShopSense;
GO
— 2.4.2.2
— Experiment 2: Assignment Validation
SELECT
e.ExperimentID,
e.ExperimentName,
ev.VariantID,
ev.VariantName,
ev.VariantDescription,
ev.AllocationPercent,
COUNT(ea.AssignmentID) AS TotalAssignments,
COUNT(DISTINCT ea.UserID) AS AssignedUsers,
COUNT(DISTINCT ea.SessionID) AS AssignedSessions,
MIN(ea.AssignmentTimestamp) AS FirstAssignment,
MAX(ea.AssignmentTimestamp) AS LastAssignment
FROM dbo.Experiments e
INNER JOIN dbo.ExperimentVariants ev
ON e.ExperimentID = ev.ExperimentID
LEFT JOIN dbo.ExperimentAssignments ea
ON e.ExperimentID = ea.ExperimentID
AND ev.VariantID = ea.VariantID
WHERE e.ExperimentID = 2
GROUP BY
e.ExperimentID,
e.ExperimentName,
ev.VariantID,
ev.VariantName,
ev.VariantDescription,
ev.AllocationPercent
ORDER BY ev.VariantID;
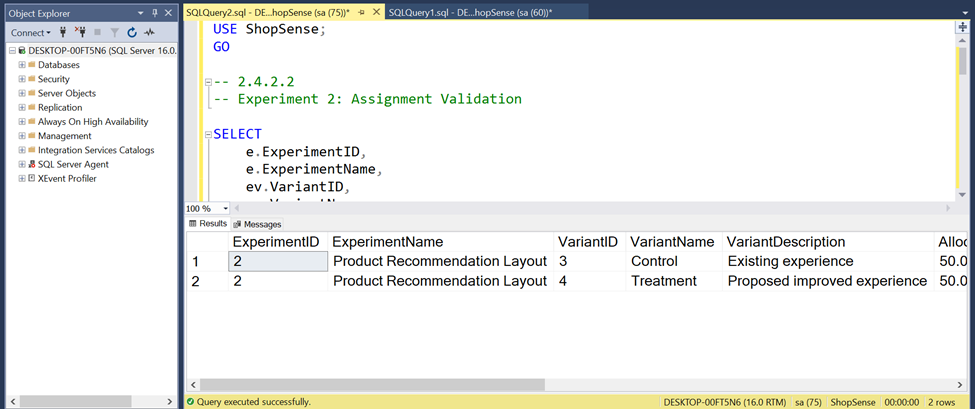
2.4.2.2A — Assignment Summary
USE ShopSense;
GO
— 2.4.2.2A
— Experiment 2: Assignment Summary
SELECT
ev.VariantName,
COUNT(ea.AssignmentID) AS TotalAssignments,
COUNT(DISTINCT ea.UserID) AS AssignedUsers,
COUNT(DISTINCT ea.SessionID) AS AssignedSessions,
CAST(
100.0 * COUNT(ea.AssignmentID)
/ NULLIF(
SUM(COUNT(ea.AssignmentID)) OVER (), 0
)
AS DECIMAL(6,2)
) AS ActualAllocationPercent,
MIN(ea.AssignmentTimestamp) AS FirstAssignment,
MAX(ea.AssignmentTimestamp) AS LastAssignment
FROM dbo.ExperimentVariants ev
LEFT JOIN dbo.ExperimentAssignments ea
ON ev.ExperimentID = ea.ExperimentID
AND ev.VariantID = ea.VariantID
WHERE ev.ExperimentID = 2
GROUP BY ev.VariantName
ORDER BY ev.VariantName;
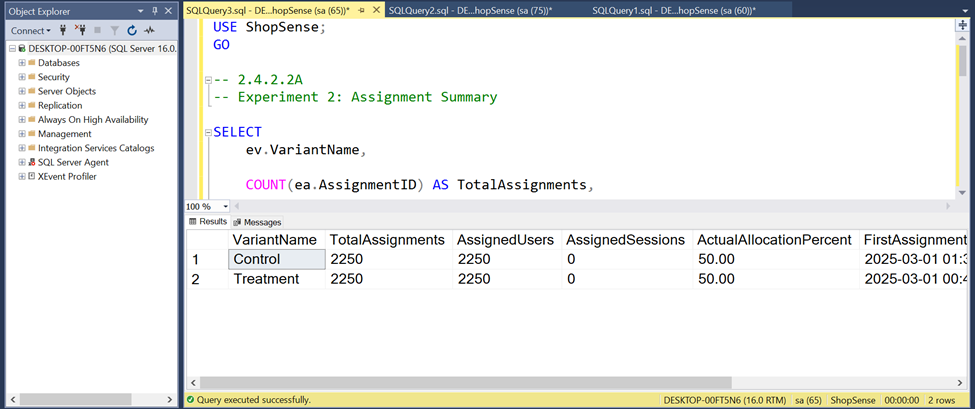
Review of Assignment Results
| Metric | Control | Treatment |
| Total Assignments | 2,250 | 2,250 |
| Assigned Users | 2,250 | 2,250 |
| Assigned Sessions | 0 | 0 |
| Actual Allocation | 50.00% | 50.00% |
Total Assignments: 4,500
Control · 50%
Treatment · 50%
Interpretation
Experiment 2 used user-level assignment with 4,500 assignments evenly distributed between Control and Treatment (2,250 each). The observed 50/50 allocation matched the planned experiment split, providing a balanced starting point for A/B analysis. Further checks are required to verify assignment exclusivity and valid post-assignment outcomes.
2.4.2.3 — Control vs Treatment KPI Analysis
USE ShopSense;
GO
— 2.4.2.3
— Experiment 2: Control vs Treatment KPI Analysis
— User-level assignment
— Post-assignment sessions within experiment dates
WITH AssignmentCheck AS
(
SELECT
ea.UserID
FROM dbo.ExperimentAssignments ea
WHERE ea.ExperimentID = 2
AND ea.UserID IS NOT NULL
GROUP BY ea.UserID
HAVING COUNT(DISTINCT ea.VariantID) = 1
),
ValidAssignments AS
(
SELECT
ea.UserID,
ev.VariantName,
MIN(ea.AssignmentTimestamp) AS AssignmentTimestamp
FROM dbo.ExperimentAssignments ea
INNER JOIN dbo.ExperimentVariants ev
ON ea.VariantID = ev.VariantID
AND ea.ExperimentID = ev.ExperimentID
INNER JOIN AssignmentCheck ac
ON ea.UserID = ac.UserID
WHERE ea.ExperimentID = 2
GROUP BY
ea.UserID,
ev.VariantName
),
EligibleSessions AS
(
SELECT
va.UserID,
va.VariantName,
s.SessionID
FROM ValidAssignments va
INNER JOIN dbo.Sessions s
ON s.UserID = va.UserID
INNER JOIN dbo.Experiments e
ON e.ExperimentID = 2
WHERE s.SessionStart >= va.AssignmentTimestamp
AND s.SessionStart >= e.StartDate
AND s.SessionStart < DATEADD(
DAY, 1, COALESCE(e.EndDate, e.StartDate)
)
),
SessionMetrics AS
(
SELECT
es.UserID,
es.VariantName,
es.SessionID,
CASE WHEN EXISTS
(
SELECT 1
FROM dbo.ProductViews pv
WHERE pv.SessionID = es.SessionID
) THEN 1 ELSE 0 END AS HasProductView,
CASE WHEN EXISTS
(
SELECT 1
FROM dbo.CartEvents ce
WHERE ce.SessionID = es.SessionID
AND ce.EventType = ‘Add’
) THEN 1 ELSE 0 END AS HasAddToCart,
CASE WHEN EXISTS
(
SELECT 1
FROM dbo.CheckoutEvents ch
WHERE ch.SessionID = es.SessionID
AND ch.EventType = ‘Started’
) THEN 1 ELSE 0 END AS HasCheckout,
CASE WHEN EXISTS
(
SELECT 1
FROM dbo.Orders o
WHERE o.SessionID = es.SessionID
) THEN 1 ELSE 0 END AS HasPurchase,
COALESCE(
(
SELECT SUM(o.TotalAmount)
FROM dbo.Orders o
WHERE o.SessionID = es.SessionID
), 0) AS SessionRevenue
FROM EligibleSessions es
)
SELECT
va.VariantName,
COUNT(DISTINCT va.UserID) AS AssignedUsers,
COUNT(sm.SessionID) AS EligibleSessions,
COALESCE(SUM(sm.HasProductView), 0)
AS ProductViewSessions,
COALESCE(SUM(
CASE
WHEN sm.HasProductView = 1
AND sm.HasAddToCart = 1
THEN 1 ELSE 0
END
), 0) AS ProductViewToCartSessions,
CAST(
100.0 * COALESCE(SUM(
CASE
WHEN sm.HasProductView = 1
AND sm.HasAddToCart = 1
THEN 1 ELSE 0
END
), 0)
/ NULLIF(SUM(sm.HasProductView), 0)
AS DECIMAL(8,2)
) AS ProductViewToCartRate,
COALESCE(SUM(sm.HasCheckout), 0)
AS CheckoutSessions,
COALESCE(SUM(sm.HasPurchase), 0)
AS PurchaseSessions,
CAST(
100.0 * COALESCE(SUM(sm.HasPurchase), 0)
/ NULLIF(COUNT(sm.SessionID), 0)
AS DECIMAL(8,2)
) AS PurchaseConversionRate,
CAST(
COALESCE(SUM(sm.SessionRevenue), 0)
/ NULLIF(COUNT(sm.SessionID), 0)
AS DECIMAL(12,2)
) AS RevenuePerSession
FROM ValidAssignments va
LEFT JOIN SessionMetrics sm
ON va.UserID = sm.UserID
AND va.VariantName = sm.VariantName
GROUP BY va.VariantName
ORDER BY va.VariantName;
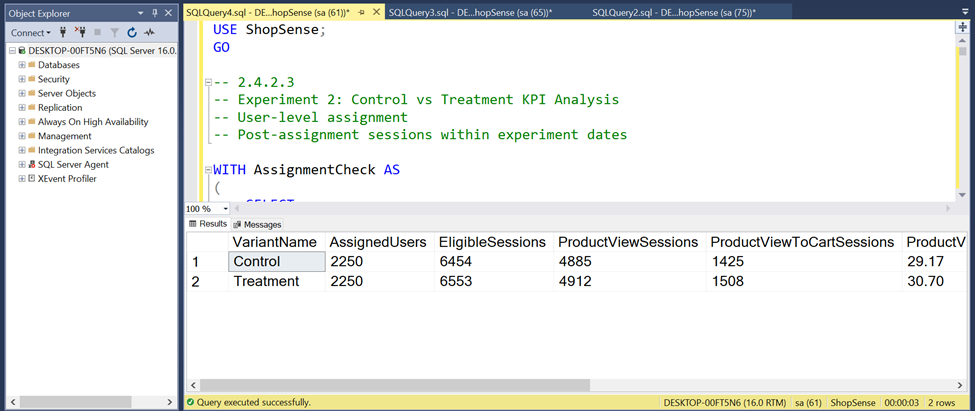
Final A/B Test KPI Comparison
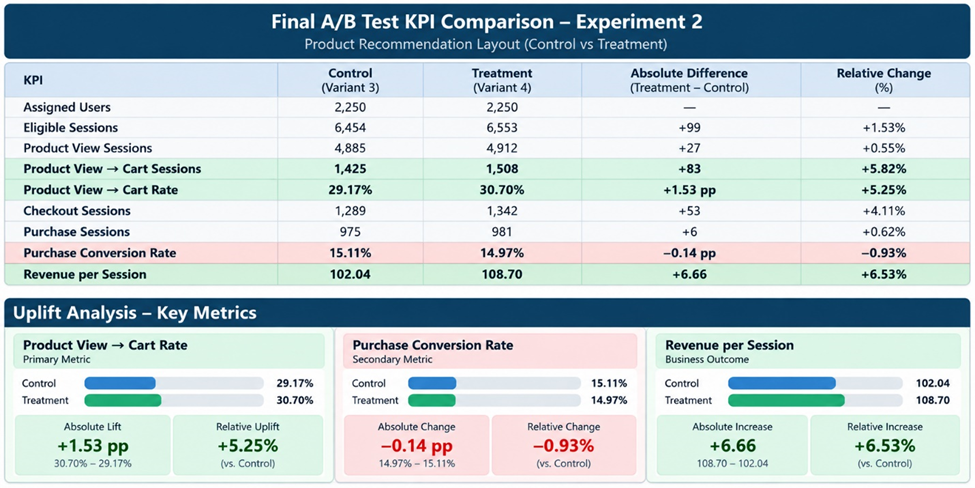
Experiment 2 showed a positive directional improvement in Product View → Add-to-Cart Rate, increasing from 29.17% in Control to 30.70% in Treatment. This represents an absolute lift of 1.53 percentage points and a relative uplift of approximately 5.25%. However, statistical validation is required before concluding that the treatment produced a reliable improvement.
Experiment 2 demonstrated a positive directional improvement in Product View → Add-to-Cart Rate, increasing from 29.17% in Control to 30.70% in Treatment (+1.53 percentage points; +5.25% relative uplift). Revenue per Session also increased by approximately 6.53%. However, Purchase Conversion Rate declined slightly from 15.11% to 14.97%. These mixed outcomes suggest that stronger cart engagement did not necessarily translate into higher purchase conversion, highlighting the importance of evaluating downstream metrics alongside the primary experiment KPI.
2.4.3 — Statistical Validation in Python
1. Primary Metric: Evaluate the difference in Product View → Cart Rate using User-Level Bootstrapping, and calculate the 95% Confidence Interval and p-value.
2. Secondary Metrics: Evaluate Purchase Conversion Rate and Revenue per Session as supplementary metrics and guardrail metrics.
3. Final Decision: Determine whether the evidence is sufficient to recommend rolling out the Treatment.
We want to determine whether the 1.53 percentage-point increase in Add-to-Cart Rate represents a statistically reliable improvement or could simply be due to random sampling variation.
2.4.3.1 — Export User-Level Experiment Data
USE ShopSense;
GO
— 2.4.3.1
— Experiment 2: User-Level Data Export
— One row per assigned user
— Control vs Treatment
WITH AssignmentCheck AS
(
SELECT UserID
FROM dbo.ExperimentAssignments
WHERE ExperimentID = 2
AND UserID IS NOT NULL
GROUP BY UserID
HAVING COUNT(DISTINCT VariantID) = 1
),
ValidAssignments AS
(
SELECT
ea.UserID,
ev.VariantName,
MIN(ea.AssignmentTimestamp) AS AssignmentTimestamp
FROM dbo.ExperimentAssignments ea
INNER JOIN dbo.ExperimentVariants ev
ON ea.ExperimentID = ev.ExperimentID
AND ea.VariantID = ev.VariantID
INNER JOIN AssignmentCheck ac
ON ea.UserID = ac.UserID
WHERE ea.ExperimentID = 2
GROUP BY ea.UserID, ev.VariantName
),
EligibleSessions AS
(
SELECT
va.UserID,
va.VariantName,
s.SessionID
FROM ValidAssignments va
INNER JOIN dbo.Sessions s
ON s.UserID = va.UserID
INNER JOIN dbo.Experiments e
ON e.ExperimentID = 2
WHERE s.SessionStart >= va.AssignmentTimestamp
AND s.SessionStart >= e.StartDate
AND s.SessionStart <
DATEADD(DAY, 1, COALESCE(e.EndDate, e.StartDate))
),
SessionMetrics AS
(
SELECT
es.UserID,
es.VariantName,
es.SessionID,
CASE WHEN EXISTS
(
SELECT 1
FROM dbo.ProductViews pv
WHERE pv.SessionID = es.SessionID
) THEN 1 ELSE 0 END AS HasProductView,
CASE WHEN EXISTS
(
SELECT 1
FROM dbo.CartEvents ce
WHERE ce.SessionID = es.SessionID
AND ce.EventType = ‘Add’
) THEN 1 ELSE 0 END AS HasAddToCart,
CASE WHEN EXISTS
(
SELECT 1
FROM dbo.Orders o
WHERE o.SessionID = es.SessionID
) THEN 1 ELSE 0 END AS HasPurchase,
COALESCE(
(
SELECT SUM(o.TotalAmount)
FROM dbo.Orders o
WHERE o.SessionID = es.SessionID
), 0) AS SessionRevenue
FROM EligibleSessions es
),
UserMetrics AS
(
SELECT
UserID,
VariantName,
COUNT(*) AS EligibleSessions,
SUM(HasProductView) AS ProductViewSessions,
SUM(
CASE
WHEN HasProductView = 1
AND HasAddToCart = 1
THEN 1 ELSE 0
END
) AS AddToCartSessions,
SUM(HasPurchase) AS PurchaseSessions,
SUM(SessionRevenue) AS TotalRevenue
FROM SessionMetrics
GROUP BY UserID, VariantName
)
SELECT
va.UserID,
va.VariantName,
COALESCE(um.EligibleSessions, 0) AS EligibleSessions,
COALESCE(um.ProductViewSessions, 0) AS ProductViewSessions,
COALESCE(um.AddToCartSessions, 0) AS AddToCartSessions,
COALESCE(um.PurchaseSessions, 0) AS PurchaseSessions,
COALESCE(um.TotalRevenue, 0) AS TotalRevenue
FROM ValidAssignments va
LEFT JOIN UserMetrics um
ON va.UserID = um.UserID
AND va.VariantName = um.VariantName
ORDER BY va.VariantName, va.UserID;
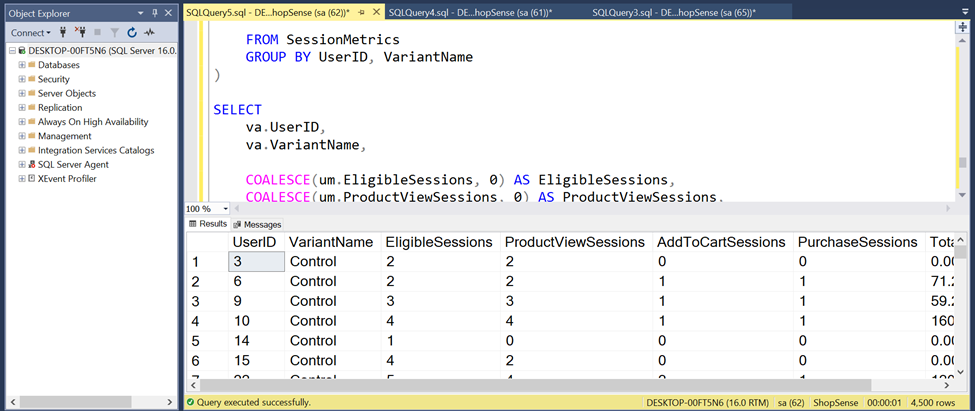
2.4.3 — Statistical Validation in Python
Experiment 2 was evaluated using user-level bootstrap confidence intervals and permutation testing to account for repeated sessions within users.
The Treatment increased Product View → Add-to-Cart Rate from 29.17% to 30.70%, representing an absolute uplift of 1.53 percentage points and a relative uplift of 5.24%.
However, the improvement was not statistically significant (p = 0.1002; 95% CI: −0.25 to +3.34 percentage points).
Purchase Conversion Rate declined slightly, while Revenue per Session increased by approximately 6.53%. Neither secondary outcome showed a statistically significant difference.
Final Decision: The experiment produced encouraging directional results, but the evidence is insufficient to justify a full Treatment rollout. Further experimentation with adequate statistical power and continued monitoring of downstream business metrics is recommended.
2.4.4 — Final Results & Business Recommendations
Experiment: Product Recommendation Layout A/B Test
The A/B experiment evaluated whether an improved product recommendation layout could increase Product View → Add-to-Cart Rate.
The Treatment achieved a 1.53 percentage-point absolute uplift (+5.24% relative) in the primary metric, increasing from 29.17% to 30.70%. However, user-level statistical validation found that this improvement was not statistically significant (p = 0.1002; 95% CI: −0.25 to +3.34 percentage points).
Secondary metrics showed mixed directional outcomes. Purchase Conversion Rate declined slightly from 15.11% to 14.97%, while Revenue per Session increased by approximately 6.53%. Neither difference was statistically significant.
Business Decision: The available evidence does not support a full rollout of the Treatment.
Recommendations:
- Conduct a follow-up experiment with adequate statistical power and a predefined minimum detectable effect.
- Monitor Purchase Conversion Rate, Checkout Completion, and Revenue per Session alongside the primary metric.
- Validate whether improved cart engagement translates into meaningful business value.
- Design a separate targeted experiment to investigate the Product View → Cart friction previously identified among high-engagement Email users.
Final Takeaway: Positive directional uplift alone is not sufficient to establish experiment success. Reliable product decisions require statistical validation, downstream business impact assessment, and careful interpretation of uncertainty.
Data Visualization & Business Intelligence
Why do highly engaged users fail to convert, and where should the business focus its optimization efforts?
Power BI Dashboard Development
We will create two report pages in Power BI:
1. Executive Overview: An overview of the store’s overall performance, revenue, conversion rates, and user behavior.
2. Conversion & Root Cause Analysis: Funnel analysis, comparison of Email and Organic traffic, and identification of key drop-off points.
3.1-Data Modelling

Power BI Data Model Refinement:
The initial Power BI data model was refined to improve clarity, organization, and analytical usability. Tables were rearranged to make relationships and data flows easier to understand, while preserving the core connections between users, sessions, searches, product interactions, orders, and experiment assignments. A disconnected Funnel Stages table was also introduced to support dynamic funnel visualizations and conversion analysis using DAX measures. These refinements made the model easier to navigate and better suited for building interactive business intelligence dashboards.

3.2 — Creating DAX Measures
1-Total Sessions =
DISTINCTCOUNT(Sessions[SessionID])
2-Search Sessions =
DISTINCTCOUNT(Searches[SessionID])
3-Purchase Sessions =
DISTINCTCOUNT(Orders[SessionID])
4-Purchase Conversion Rate =
DIVIDE(
[Purchase Sessions],
[Total Sessions],
0
)
5-Total Revenue =
SUM(Orders[TotalAmount])
6-Revenue per Session =
DIVIDE(
[Total Revenue],
[Total Sessions],
0
)
7-Add-to-Cart Sessions =
CALCULATE(
DISTINCTCOUNT(CartEvents[SessionID]),
CartEvents[EventType] = “Add”
)
Step 1 — Create Three New Measures
1-Product View Sessions =
DISTINCTCOUNT(ProductViews[SessionID])
2-Checkout Sessions =
CALCULATE(
DISTINCTCOUNT(CheckoutEvents[SessionID]),
CheckoutEvents[EventType] = “Started”
)
3-Purchase Sessions Fixed =
CALCULATE(
DISTINCTCOUNT(Orders[SessionID]),
TREATAS(
VALUES(Sessions[SessionID]),
Orders[SessionID]
)
)
4-Purchase Conversion Rate Fixed =
DIVIDE(
[Purchase Sessions Fixed],
[Total Sessions],
0
)
3.3 — KPI Validation
| KPI | Amount |
| Total Sessions | 40,000 |
| Search Sessions | 26,000 |
| Purchase Conversion Rate | 15.00% |
| Add-to-Cart Sessions | 12,000 |
| Revenue per Session | 107.85 |
| Total Revenue | 4.31M |
The 15% Conversion Rate is consistent with 6,000 Purchase Sessions out of 40,000 Total Sessions. Additionally, Revenue per Session aligns with the displayed Total Revenue.
Since the values shown on the Cards are rounded, minor discrepancies are expected.
3.4 — Conversion Funnel Visualization
For the Funnel analysis, we measure each stage at the Session level. Therefore, a user with multiple similar events within the same session is counted only once per stage.
Step 2 — Create the Funnel Stages Table
Funnel Stages =
DATATABLE(
“Stage”, STRING,
“SortOrder”, INTEGER,
{
{“Sessions”, 1},
{“Product View”, 2},
{“Add-to-Cart”, 3},
{“Checkout”, 4},
{“Purchase”, 5}
}
)
Step 3 — Create the Funnel Measure
Funnel Sessions =
SWITCH(
SELECTEDVALUE(‘Funnel Stages'[stage]),
“Sessions”, [Total Sessions],
“Product View”, [Product View Sessions],
“Add-to-Cart”, [Add-to-Cart Sessions],
“Checkout”, [Checkout Sessions],
“Purchase”, [Purchase Sessions Fixed],
BLANK()
)
3.5 — Revenue Trend
1-Total Revenue Fixed =
CALCULATE(
SUM(Orders[TotalAmount]),
REMOVEFILTERS(Orders),
TREATAS(
VALUES(Sessions[SessionID]),
Orders[SessionID]
)
)
2-Revenue per Session Fixed =
DIVIDE(
[Total Revenue Fixed],
[Total Sessions],
0
)
Dashboard 1
ShopSense | Executive Overview
E-commerce Performance & Customer Journey Analytics

Developed an interactive Power BI dashboard to provide a comprehensive overview of ShopSense’s e-commerce performance and customer journey.
The dashboard tracks six key performance indicators (KPIs), including Total Revenue, Purchase Conversion Rate, Revenue per Session, Total Sessions, Search Sessions, and Add-to-Cart Sessions.
Through monthly revenue trends, a customer conversion funnel, device distribution, and traffic source comparisons, the dashboard helps stakeholders monitor business performance, identify conversion drop-offs, and understand customer behavior.
Key Results: $4.31M in total revenue, a 15.00% purchase conversion rate, and 40,000 customer sessions.
Business Value: Transforms transactional and behavioral data into clear, actionable insights to support data-driven decisions and conversion optimization.
Dashboard 2
ShopSense | Conversion & Root Cause Analysis
In the first dashboard, we analyzed the store’s overall performance. Now, in the second dashboard, we aim to answer an important business question:
Why do highly engaged customers fail to convert, particularly in the Email channel?
According to our SQL analysis, the Product View → Add-to-Cart Conversion Rate among highly engaged sessions was 20.00% for Email traffic, compared with 32.13% for Organic traffic.
Our goal is to visualize this performance gap and identify key drop-off points, rather than claim that we have established its underlying cause.
Creating KPI Measure:
1. Product View Sessions
Product View Sessions =
DISTINCTCOUNT(ProductViews[SessionID])
2. Product View to Cart Sessions
Product View to Cart Sessions =
VAR ViewedSessions =
VALUES(ProductViews[SessionID])
VAR CartSessions =
CALCULATETABLE(
VALUES(CartEvents[SessionID]),
CartEvents[EventType] = “Add”
)
RETURN
COUNTROWS(
INTERSECT(ViewedSessions, CartSessions)
)
3. Product View to Cart Rate
Product View to Cart Rate =
DIVIDE(
[Product View to Cart Sessions],
[Product View Sessions],
0
)
4.Product View Without Cart Sessions
Product View Without Cart Sessions =
[Product view Sessions]
– [Product View to Cart Sessions]
5. High Engagement Sessions
COUNTROWS(
FILTER(
VALUES(Sessions[SessionID]),
CALCULATE(
COUNTROWS(Searches)
) >= 4
)
)
6. HE Product View to Cart Rate
HE Product View to Cart Rate =
VAR HighEngagementSessions =
FILTER(
VALUES(Sessions[SessionID]),
CALCULATE(COUNTROWS(Searches)) >= 4
)
VAR ViewedSessions =
CALCULATETABLE(
VALUES(ProductViews[SessionID]),
TREATAS(
HighEngagementSessions,
ProductViews[SessionID]
)
)
VAR CartSessions =
CALCULATETABLE(
VALUES(CartEvents[SessionID]),
REMOVEFILTERS(CartEvents),
CartEvents[EventType] = “Add”,
TREATAS(
HighEngagementSessions,
CartEvents[SessionID]
)
)
VAR ConvertedSessions =
INTERSECT(ViewedSessions, CartSessions)
RETURN
DIVIDE(
COUNTROWS(ConvertedSessions),
COUNTROWS(ViewedSessions)
)
7. Create the Conversion Stages Table
HE Conversion Stages =
DATATABLE(
“Stage”, STRING,
“SortOrder”, INTEGER,
{
{“Product View”, 1},
{“Add-to-Cart”, 2},
{“Checkout”, 3},
{“Payment”, 4},
{“Completed”, 5}
}
)

Power BI Data Model Enhancement – Conversion Analysis:
The Power BI data model was further enhanced by introducing a disconnected HE Conversion Stages table to support stage-to-stage conversion analysis for high-engagement sessions. This new table complements the existing Funnel Stages table, enabling DAX measures to calculate and compare conversion rates across different stages of the customer journey. The model layout was also reorganized for better readability, while preserving the existing relationships between transactional and behavioral tables. These enhancements enabled a more detailed comparison of Email and Organic traffic, helping identify conversion gaps and potential friction points in the purchase journey.
8. HE Checkout Started Sessions
HE Checkout Started Sessions =
VAR HighEngagementSessions =
FILTER(
VALUES(Sessions[SessionID]),
CALCULATE(COUNTROWS(Searches)) >= 4
)
RETURN
CALCULATE(
DISTINCTCOUNT(CheckoutEvents[SessionID]),
REMOVEFILTERS(CheckoutEvents),
CheckoutEvents[EventType] = “Started”,
TREATAS(
HighEngagementSessions,
CheckoutEvents[SessionID]
)
)
9. HE Payment Sessions
HE Payment Sessions =
VAR HighEngagementSessions =
FILTER(
VALUES(Sessions[SessionID]),
CALCULATE(
COUNTROWS(Searches)
) >= 4
)
VAR PaymentSessions =
CALCULATETABLE(
VALUES(CheckoutEvents[SessionID]),
CheckoutEvents[EventType] = “Payment”
)
RETURN
COUNTROWS(
INTERSECT(
HighEngagementSessions,
PaymentSessions
)
)
10. HE Payment Intersection Test
HE Payment Intersection Test =
VAR HESessions =
FILTER(
ALL(Sessions[SessionID]),
CALCULATE(COUNTROWS(Searches)) >= 4
)
VAR PaymentSessions =
CALCULATETABLE(
VALUES(CheckoutEvents[SessionID]),
REMOVEFILTERS(CheckoutEvents),
CheckoutEvents[EventType] = “Payment”
)
RETURN
COUNTROWS(
INTERSECT(
HESessions,
PaymentSessions
)
)
11. HE Completed Sessions
HE Completed Sessions =
VAR HESessions =
FILTER(
ALL(Sessions[SessionID]),
CALCULATE(COUNTROWS(Searches)) >= 4
)
VAR CompletedSessions =
CALCULATETABLE(
VALUES(CheckoutEvents[SessionID]),
REMOVEFILTERS(CheckoutEvents),
CheckoutEvents[EventType] = “Completed”
)
RETURN
COUNTROWS(
INTERSECT(
HESessions,
CompletedSessions
)
)
12. HE Funnel Sessions
HE Funnel Sessions =
SWITCH(
SELECTEDVALUE(‘HE Conversion Stages'[Stage]),
“Product View”, [HE Product View Sessions Diagnostic],
“Add-to-Cart”, [He Cart Sessions Check],
“Checkout”, [He Checkout Started Sessions],
“Payment”, [HE Payment Intersection Test],
“Completed”, [HE Completed Sessions],
BLANK()
)
13. HE Conversion Rate Stages table
HE Conversion Rate Stages =
DATATABLE(
“Stage”, STRING,
“SortOrder”, INTEGER,
{
{“View to Cart”, 1},
{“Cart to Checkout”, 2},
{“Checkout to Payment”, 3},
{“Payment to Completed”, 4}
}
)
14. HE Stage Conversion Rate
HE Stage Conversion Rate =
VAR CurrentStage =
SELECTEDVALUE(‘HE Conversion Rate Stages'[Stage])
RETURN
SWITCH(
CurrentStage,
“View to Cart”,
DIVIDE(
[He Cart Sessions Check],
[HE Product View Sessions Diagnostic]
),
“Cart to Checkout”,
DIVIDE(
[He Checkout Started Sessions],
[He Cart Sessions Check]
),
“Checkout to Payment”,
DIVIDE(
[HE Payment Intersection Test],
[He Checkout Started Sessions]
),
“Payment to Completed”,
DIVIDE(
[HE Completed Sessions],
[HE Payment Intersection Test]
),
BLANK()
)
15.He Product View Sassions Diagnostic
HE Product View Sessions Diagnostic =
VAR HighEngagementSessions =
FILTER(
VALUES(Sessions[SessionID]),
CALCULATE(COUNTROWS(Searches)) >= 4
)
RETURN
COUNTROWS(
CALCULATETABLE(
VALUES(ProductViews[SessionID]),
TREATAS(
HighEngagementSessions,
ProductViews[SessionID]
)
)
)
16.He Cart Sessions Check
HE Cart Sessions Check =
VAR HighEngagementSessions =
FILTER(
VALUES(Sessions[SessionID]),
CALCULATE(COUNTROWS(Searches)) >= 4
)
RETURN
CALCULATE(
DISTINCTCOUNT(CartEvents[SessionID]),
CartEvents[EventType] = “Add”,
REMOVEFILTERS(CartEvents),
TREATAS(
HighEngagementSessions,
CartEvents[SessionID]
)
)

The Conversion & Root Cause Analysis dashboard investigates customer journey friction, focusing on high-engagement sessions (four or more searches). The analysis revealed a significant conversion gap between Email and Organic traffic at the Product View → Add-to-Cart stage, with conversion rates of 20.00% and 32.13%, respectively—a difference of 12.13 percentage points. Interestingly, Email traffic performed better at the subsequent Cart → Checkout stage (85.71% vs. 66.38%), indicating that the primary observed friction occurs earlier in the purchase journey. Further analysis of product exposure, pricing, discounts, ratings, reviews, and stock availability did not reveal a clear explanation for this gap. Based on these findings, an enhanced product-page experience was recommended for A/B testing, focusing on clearer calls to action, promotional messaging, and delivery/return information. The objective is to improve add-to-cart conversion while monitoring downstream purchase conversion and revenue per session. The underlying cause remains a hypothesis rather than a confirmed causal finding.
Tableau
Dashboard 3 — A/B Testing & Experiment Performance
Our goal is to evaluate the performance of the Control and Treatment groups in Experiment 2: Product Recommendation Layout.
Step 1 — Prepare the Data in SQL Server
For Tableau, it is better to first create a clean, consolidated dataset that contains all the information required for the dashboard in a single table.
Field Description
UserID Unique user identifier
VariantName Control / Treatment
EligibleSessions Number of eligible sessions
ProductViewSessions Number of sessions with at least one product view
ProductViewToCartSessions Number of sessions with both a product view and an add-to-cart event
PurchaseSessions Number of sessions with at least one order
TotalRevenue Total revenue generated from sessions
USE ShopSense;
GO
— Dashboard 3 | Experiment 2 Dataset
WITH ValidAssignments AS (
SELECT
ea.UserID,
MAX(ev.VariantName) AS VariantName,
MIN(ea.AssignmentTimestamp) AS AssignmentTimestamp
FROM dbo.ExperimentAssignments ea
INNER JOIN dbo.ExperimentVariants ev
ON ea.VariantID = ev.VariantID
AND ea.ExperimentID = ev.ExperimentID
WHERE ea.ExperimentID = 2
AND ea.UserID IS NOT NULL
GROUP BY ea.UserID
HAVING COUNT(DISTINCT ea.VariantID) = 1
),
EligibleSessions AS (
SELECT
va.UserID,
va.VariantName,
s.SessionID
FROM ValidAssignments va
INNER JOIN dbo.Sessions s
ON s.UserID = va.UserID
INNER JOIN dbo.Experiments e
ON e.ExperimentID = 2
WHERE s.SessionStart >= va.AssignmentTimestamp
AND s.SessionStart >= e.StartDate
AND s.SessionStart < DATEADD(
DAY, 1, COALESCE(e.EndDate, e.StartDate)
)
),
SessionMetrics AS (
SELECT
es.UserID,
es.SessionID,
CASE WHEN EXISTS (
SELECT 1
FROM dbo.ProductViews pv
WHERE pv.SessionID = es.SessionID
) THEN 1 ELSE 0 END AS HasProductView,
CASE WHEN EXISTS (
SELECT 1
FROM dbo.CartEvents ce
WHERE ce.SessionID = es.SessionID
AND ce.EventType = ‘Add’
) THEN 1 ELSE 0 END AS HasAddToCart,
CASE WHEN EXISTS (
SELECT 1
FROM dbo.Orders o
WHERE o.SessionID = es.SessionID
) THEN 1 ELSE 0 END AS HasPurchase,
COALESCE((
SELECT SUM(o.TotalAmount)
FROM dbo.Orders o
WHERE o.SessionID = es.SessionID
), 0) AS SessionRevenue
FROM EligibleSessions es
)
SELECT
va.UserID,
va.VariantName,
COUNT(sm.SessionID) AS EligibleSessions,
COALESCE(SUM(sm.HasProductView), 0)
AS ProductViewSessions,
COALESCE(SUM(
CASE
WHEN sm.HasProductView = 1
AND sm.HasAddToCart = 1
THEN 1 ELSE 0
END
), 0) AS ProductViewToCartSessions,
COALESCE(SUM(sm.HasPurchase), 0)
AS PurchaseSessions,
COALESCE(SUM(sm.SessionRevenue), 0)
AS TotalRevenue
FROM ValidAssignments va
LEFT JOIN SessionMetrics sm
ON va.UserID = sm.UserID
GROUP BY
va.UserID,
va.VariantName
ORDER BY
va.VariantName,
va.UserID;

Add-to-Cart Conversion Rate | Control vs Treatment
Important Note: Since each row represents a single user, we calculate conversion rates in Tableau using the ratio of aggregated totals.
Create Calculated Field:
1.PV to Cart Conversion Rate
SUM([ProductViewToCartSessions])
/
SUM([ProductViewSessions])
2.Purchase Conversion Rate
SUM([PurchaseSessions])
/
SUM([EligibleSessions])
3. Revenue per Session
SUM([TotalRevenue])
/
SUM([EligibleSessions])
4. Add-to-Cart Uplift (pp)
(
{ FIXED : SUM(
IF [VariantName] = “Treatment”
THEN [ProductViewToCartSessions] END
)}
/
{ FIXED : SUM(
IF [VariantName] = “Treatment”
THEN [ProductViewSessions] END
)}
–
{ FIXED : SUM(
IF [VariantName] = “Control”
THEN [ProductViewToCartSessions] END
)}
/
{ FIXED : SUM(
IF [VariantName] = “Control”
THEN [ProductViewSessions] END
)}
) * 100

This dashboard evaluates the performance of Control and Treatment groups in Experiment 2, Product Recommendation Layout, to assess the impact of the proposed experience on customer conversion and revenue. The Treatment group achieved a higher Product View-to-Cart Conversion Rate, increasing from 29.17% to 30.70%, representing a +1.53 percentage-point improvement (+5.25% relative uplift). Revenue per Session also increased from 102.04 to 108.70 (+6.53%), suggesting a positive directional impact on revenue generation. However, Purchase Conversion Rate declined slightly from 15.11% to 14.97% (−0.14 percentage points), indicating that increased cart engagement did not translate into higher purchase conversion. These mixed results highlight the importance of monitoring downstream business outcomes alongside the primary experiment metric. Statistical validation is required before determining whether the observed improvements are significant and recommending a full rollout.
Key points:
- 1. Customer Journey & Behavioral Analysis
- The analysis identified a meaningful segment of highly engaged users who interacted extensively with search and product-discovery features but did not complete a purchase.
- High engagement was operationally defined as sessions containing four or more searches (SearchCount >= 4), providing a consistent cohort definition for deeper behavioral analysis.
- High engagement alone did not guarantee conversion, demonstrating that strong search activity and product exploration can coexist with substantial downstream funnel friction.
- This finding shifted the analysis from measuring engagement alone toward identifying where highly engaged users fail to progress toward purchase.
- 2. Search Engagement Analysis
- High-engagement non-purchasing users continued to interact heavily with search results and products, indicating that their failure to convert was not simply caused by a lack of activity or product exploration.
- When Email and Organic high-engagement non-purchasing sessions were compared, their average search activity was very similar: 4.11 searches per Email session vs. 4.18 for Organic.
- Email users generated slightly more search-result interactions, averaging 7.90 search clicks per session vs. 7.39 for Organic.
- Email users also recorded slightly more product exploration, with 8.39 product views per session vs. 7.92 for Organic.
- Average product-view duration was also broadly comparable: 243.02 seconds for Email vs. 254.81 seconds for Organic.
- These results suggest that the Email conversion issue is not explained by weaker search engagement or substantially lower product browsing activity.
- 3. Traffic Source Analysis — Email vs. Organic
- Traffic-source analysis identified Email as an important segment for deeper investigation, particularly among high-engagement users who failed to purchase.
- Despite substantial search and product interaction, Email users showed weaker progression toward the cart than comparable Organic users.
- This distinction is important: the observed issue is not that Email users are disengaged; rather, they appear to be engaged users who encounter friction after product discovery.
- Organic therefore served as a useful behavioral benchmark for understanding where Email sessions diverged in the purchase journey.
- 4. Device-Level Analysis
- Device segmentation showed that the weaker Email progression was not isolated to a single device type.
- Among high-engagement non-purchasing sessions, Cart Progression was 9.09% for Email Desktop vs. 18.48% for Organic Desktop.
- On Mobile, the corresponding rates were 8.70% for Email vs. 19.90% for Organic.
- Tablet showed 0.00% for Email vs. 32.00% for Organic, although the Email Tablet cohort contained only 5 sessions, making this estimate highly unstable.
- Because the Email gap appeared across Desktop and Mobile as well as the very small Tablet segment, the evidence does not support a purely device-specific explanation.
- The small Tablet sample also demonstrates the importance of considering sample size alongside percentage differences rather than interpreting extreme rates in isolation.
- 5. Category Mix Analysis
- Category reach analysis showed some differences between Email and Organic users, but both traffic sources interacted with a broad range of product categories.
- Certain categories were more heavily represented among Email sessions. For example, Furniture reached 40.98% of Email sessions vs. 30.84% of Organic sessions, a difference of +10.14 percentage points.
- Other notable Email-overrepresented categories included Gaming (+8.50 pp), Menswear (+7.90 pp), Womenswear (+6.23 pp), Laptops (+6.20 pp), and Nonfiction (+5.98 pp).
- However, category differences alone did not provide sufficient evidence that the overall Email conversion problem was caused primarily by a different product-category mix.
- 6. Category-Level Cart Progression
- Cart progression varied across categories, confirming that product/category context influences funnel behavior.
- Across the combined high-engagement non-purchasing cohort, category-level Cart Progression ranged from approximately 14.78% for Fitness to 23.36% for Travel among the observed categories.
- More importantly, when category and traffic source were analyzed together, Email generally showed lower Cart Progression than Organic within the same categories.
- Examples included Womenswear: 4.17% Email vs. 21.57% Organic, Furniture: 4.00% vs. 21.05%, and Makeup: 7.41% vs. 23.44%.
- Similar gaps appeared across several other categories, suggesting that the Email problem cannot be explained solely by Email users browsing a less-converting category mix.
- The pattern instead points toward a traffic-source-related behavioral difference occurring within categories.
- 7. Product View → Cart — Primary Funnel Friction
- The clearest funnel difference was identified at the Product View → Cart transition.
- Within the high-engagement, non-purchasing cohort, Email users had a Product View → Cart progression rate of 8.20%, compared with 20.45% for Organic users.
- This represented an absolute difference of 12.26 percentage points, making Product View → Cart the strongest candidate for the primary friction point.
- Importantly, users had already searched, clicked, and viewed products before reaching this stage. The problem therefore appears after product discovery but before purchase intent is translated into an Add-to-Cart action.
- 8. Statistical Validation of the Product View → Cart Gap
- A two-proportion Z-test was used to evaluate whether the observed Email–Organic difference could reasonably be attributed to sampling variation.
- The test produced a Z-statistic of 2.2559 and a p-value of 0.0241.
- Because p < 0.05, the null hypothesis of equal progression rates was rejected at the 5% significance level.
- The estimated absolute difference was 12.26 percentage points, with a 95% confidence interval of 4.03% to 20.48%.
- Cohen’s h = 0.3579 indicated a meaningful difference in practical terms rather than relying solely on statistical significance.
- Together, these results provide stronger evidence that the lower Email Product View → Cart progression is a real behavioral signal in the analyzed dataset.
- 9. Cart → Checkout Analysis
- Among high-engagement non-purchasing users who reached the cart, Email users did not show weaker progression into checkout.
- Email achieved a 60.00% Cart → Checkout rate, compared with 38.10% for Organic in this restricted cohort.
- This indicates that the strongest Email friction occurs before the cart, rather than consistently throughout every downstream funnel stage.
- Once an Email user expressed stronger purchase intent by adding a product to the cart, subsequent progression was considerably better than the earlier Product View → Cart transition.
- 10. Checkout → Payment Analysis
- Within the high-engagement non-purchasing cohort, Email showed 0 of 3 Checkout Started sessions reaching Payment, compared with 7 of 24 Organic sessions (29.17%).
- However, the Email result is based on only three observations, making 0/3 insufficient evidence of a general Email payment-stage problem.
- This result should therefore be treated as a secondary signal requiring more data, rather than as a confirmed root cause.
- The analysis demonstrates why funnel percentages should always be interpreted together with their underlying denominators.
- 11. Payment → Completed Analysis
- To correctly analyze the final funnel stage, the No Purchase restriction was removed because retaining it would structurally exclude successful purchases.
- Across all high-engagement sessions, Email recorded 9 Payment sessions and 9 Completed sessions, producing a 100.00% Payment → Completed rate.
- Organic recorded 60 Payment sessions and 53 Completed sessions, corresponding to 88.33%.
- Therefore, once Email users actually reached Payment, there was no evidence of a systematic completion problem in this dataset.
- The 100% Email rate should nevertheless be interpreted cautiously because it is based on only nine Payment sessions.
- 12. Full Funnel Comparison
- A final comparison using a consistent cohort of all high-engagement Email and Organic sessions was conducted to avoid mixing populations across funnel stages.
- Email contained 70 high-engagement sessions, while Organic contained 361; all of these sessions reached Product View.
- Email progressed from Product View → Cart at 20.00%, compared with 32.13% for Organic, a 12.13 percentage-point disadvantage.
- After reaching the cart, Email performed strongly: Cart → Checkout was 85.71% for Email vs. 66.38% for Organic.
- Checkout → Payment was relatively similar: 75.00% for Email vs. 77.92% for Organic, a difference of only 2.92 percentage points.
- Payment → Completed was 100.00% for Email vs. 88.33% for Organic, although the smaller Email denominator requires cautious interpretation.
- Overall Product View → Completed conversion was 12.86% for Email vs. 14.68% for Organic, leaving a relatively modest final difference of 1.82 percentage points.
- Overall Analytical Conclusion
- The evidence consistently identifies Product View → Cart as the clearest friction point for high-engagement Email users.
- The issue does not appear to originate from insufficient search activity, because Email users demonstrated search, click, product-view, and viewing-duration behavior broadly comparable to Organic users.
- The pattern is also not adequately explained by device mix or category mix, because weaker Email cart progression appeared across multiple devices and within multiple product categories.
- Once Email users entered the cart, their downstream behavior was generally comparable to or stronger than Organic users, substantially narrowing the final conversion gap.
- The current evidence therefore supports a focused diagnosis: Email users successfully discover and explore products but are less likely to translate that engagement into an Add-to-Cart action.
- This makes the Search/Product Discovery → Product Evaluation → Cart transition the highest-priority area for the next root-cause investigation, rather than treating checkout or payment as the primary problem.
A/B Testing & Experiment Design:
- Extended the analysis from customer behavior and funnel diagnostics to experimentation, using Experiment 2 (Product Recommendation Layout) to evaluate an alternative product experience.
- Analyzed two equally allocated groups, Control and Treatment, with 2,250 assigned users per variant.
- Defined Product View-to-Cart Conversion Rate as the primary performance indicator, while monitoring Purchase Conversion Rate and Revenue per Session as downstream business metrics.
- Distinguished the existing experiment from the proposed Email-specific product-page intervention, ensuring that experimental findings were not incorrectly presented as direct proof of the original Email conversion problem.
A/B Test Performance — Primary Metric
- The Treatment group achieved a 30.70% Product View-to-Cart Conversion Rate, compared with 29.17% for Control.
- This represented an absolute improvement of +1.53 percentage points and a +5.25% relative uplift.
- The result provided a positive directional signal that the alternative product recommendation layout may improve progression from product exploration to cart engagement.
Downstream Conversion & Revenue Impact
- Purchase Conversion Rate decreased slightly from 15.11% in Control to 14.97% in Treatment, a difference of −0.14 percentage points.
- Revenue per Session increased from 102.04 to 108.70, representing a +6.53% relative improvement.
- These mixed outcomes demonstrated that stronger Add-to-Cart engagement does not necessarily translate into higher purchase conversion.
- Evaluating multiple KPIs provided a more balanced assessment of experiment performance than relying exclusively on the primary conversion metric.
Experiment Interpretation & Decision-Making
- The Treatment showed promising directional improvements in Add-to-Cart Conversion and Revenue per Session, but the results alone were insufficient to justify a full rollout.
- Statistical validation and uncertainty estimates are necessary to determine whether the observed differences provide reliable evidence of improvement.
- Recommended further investigation into the gap between cart engagement and completed purchases, while monitoring downstream conversion and revenue metrics before making a deployment decision.
Business Intelligence & Data Storytelling
- Developed three complementary dashboards to communicate e-commerce performance, conversion friction, and experimentation outcomes.
- Used Power BI for executive-level reporting and customer journey analysis, and Tableau for A/B experiment performance visualization.
- Translated technical findings into business-focused recommendations, connecting customer behavior, funnel performance, and experimental results.
- Structured the dashboards to support a coherent analytical narrative, progressing from performance monitoring to problem diagnosis and evidence-based recommendations.
Results & Recommendations:
- 1. Identified the Primary Conversion Bottleneck
The analysis identified the Product View → Cart transition as the most significant observed friction point among high-engagement Email users. Their conversion rate was 20.00%, compared with 32.13% for Organic traffic, representing a 12.13 percentage-point gap. This finding helped prioritize product evaluation and cart engagement over broader changes to the checkout process.
- 2. Narrowed Down Potential Causes
Further investigation showed that differences in search engagement, device usage, product-category distribution, pricing, discounts, ratings, reviews, and product availability did not provide a convincing explanation for the observed conversion gap. Although the exact underlying cause remains unconfirmed, the analysis narrowed the investigation toward the experience between product discovery and Add-to-Cart.
- 3. Evaluated A/B Experiment Performance
Experiment 2, Product Recommendation Layout, showed a positive directional improvement in Product View-to-Cart Conversion Rate, increasing from 29.17% in Control to 30.70% in Treatment (+1.53 percentage points; +5.25% relative uplift).
Revenue per Session also increased by 6.53%, while Purchase Conversion Rate declined slightly by 0.14 percentage points. These mixed results highlighted the need to evaluate overall business performance rather than relying on a single experiment metric.
- 4. Established a Data-Driven Decision Framework
The project combined behavioral segmentation, funnel analysis, statistical testing, and business intelligence dashboards to support evidence-based decision-making. Rather than treating increased engagement as proof of business success, the analysis distinguished observed improvements from statistically validated outcomes and emphasized the importance of downstream conversion and revenue metrics.
Business Recommendations
- 1. Test an Enhanced Product-Page Experience
Design a targeted A/B experiment for high-engagement Email users, focusing on clearer Add-to-Cart buttons, promotional messaging, delivery information, return policies, and customer confidence signals. Use Product View-to-Cart Conversion Rate as the primary metric, while monitoring Purchase Conversion Rate and Revenue per Session.
- 2. Improve Email-to-Product Experience Consistency
Review the alignment between Email campaign messaging, promotional offers, landing pages, and product details. Ensure that customers encounter consistent pricing, discounts, product information, and expectations throughout their journey. Treat message mismatch as a hypothesis to test rather than an established cause.
- 3. Investigate Cart-to-Purchase Behavior
Although the existing experiment increased Add-to-Cart engagement, it did not produce a corresponding improvement in Purchase Conversion Rate. Further analysis should examine cart abandonment, checkout progression, shipping costs, payment friction, and purchasing behavior to understand where additional conversions may be lost.
- 4. Validate Experimental Results Before Rollout
Conduct statistical validation using appropriate methods that account for user-level experiment assignment. Evaluate confidence intervals, statistical significance, and practical business impact before recommending full deployment of the Treatment experience. Consider additional experimentation if the evidence remains inconclusive.
- 5. Establish Continuous Conversion Monitoring
Use the Power BI and Tableau dashboards to track funnel performance, traffic-source differences, high-engagement customer behavior, experiment results, and revenue outcomes. Regular monitoring can help identify emerging friction points, evaluate future improvements, and support continuous optimization.
- Final Business Conclusion
ShopSense demonstrates how an end-to-end analytics workflow can transform a broad business concern—high customer engagement without corresponding purchases—into a focused, measurable optimization opportunity. By identifying the Product View-to-Cart stage as the primary observed bottleneck, investigating alternative explanations, and evaluating a related A/B experiment, the project provides a foundation for targeted product improvements and evidence-based decision-making. The findings support further experimentation and statistical validation rather than an immediate full rollout, reinforcing the importance of balancing engagement metrics with actual conversion and revenue performance.
Action: Tools, Techniques & Analytical Implementation
In this project, I applied SQL, data modeling, statistical analysis, and business intelligence techniques to investigate customer behavior, identify conversion bottlenecks, evaluate A/B testing results, and translate analytical findings into actionable business recommendations.
1. SQL Server — Data Extraction & Analysis
Used SQL Server Management Studio (SSMS) to design and query a relational e-commerce database, validate data quality, analyze customer journeys, and calculate conversion metrics.
SQL Functions & Clauses:
Aggregate Functions: SUM, COUNT, AVG, MIN, MAX, COUNT(DISTINCT)
Query Operations: SELECT, WHERE, GROUP BY, HAVING, ORDER BY, DISTINCT
Joins: INNER JOIN, LEFT JOIN
Conditional Logic: CASE WHEN, COALESCE, NULLIF
Date Functions: DATEADD, DATEDIFF
Advanced Query Techniques: Common Table Expressions (CTEs), subqueries, EXISTS, and conditional aggregation
Key Applications: Funnel analysis, traffic-source segmentation, product-level analysis, conversion-rate calculations, data validation, and A/B experiment performance evaluation.
2. Data Modeling & Data Preparation
Designed and refined the relational data structure to support reliable analysis and interactive reporting.
Techniques:
Relational database design and normalization (3NF)
Primary and foreign keys
Entity Relationship Diagrams (ERDs)
Table relationships and filter propagation
Data cleaning, type conversion, and duplicate validation
Data aggregation and transformation
Disconnected helper tables for dynamic funnel analysis
Key Applications: Building a consistent analytical foundation for Power BI and Tableau dashboards.
3. Power BI: DAX & Business Intelligence
Developed interactive dashboards to monitor e-commerce performance, analyze customer engagement, and identify conversion friction across traffic sources.
DAX Functions & Techniques:
Aggregation: SUM, COUNTROWS, DISTINCTCOUNT
Filter Context: CALCULATE, CALCULATETABLE, FILTER, ALL, REMOVEFILTERS
Logical Functions: IF, SWITCH, ISBLANK
Table Functions: VALUES, INTERSECT, DATATABLE
Context & Relationships: SELECTEDVALUE, TREATAS
Calculation Handling: DIVIDE, VAR, RETURN
Key Applications: KPI development, dynamic conversion funnels, high-engagement segmentation, stage-to-stage conversion analysis, and Email vs. Organic performance comparisons.
4. Tableau — Calculated Fields & Visualization
Used Tableau to develop the A/B Testing & Experiment Performance dashboard and compare Control and Treatment groups.
Techniques:
Calculated fields and aggregate calculations
SUM and conditional IF expressions
FIXED Level of Detail (LOD) expressions
Percentage-point and relative uplift calculations
KPI cards and comparative bar charts
Dashboard formatting and data storytelling
Key Applications: Visualizing Add-to-Cart Conversion Rate, Purchase Conversion Rate, Revenue per Session, and experiment uplift.
5. Python — Statistical Analysis & Experiment Evaluation
Applied Python-based statistical techniques to evaluate conversion differences and support evidence-based interpretation of experimental results.
Libraries & Techniques:
Pandas and NumPy for data manipulation and numerical calculations
Statistical hypothesis testing
Conversion-rate comparisons
Confidence interval estimation
Effect-size interpretation
User-level bootstrap methodology for A/B experiment evaluation
Key Applications: Assessing uncertainty in conversion differences and distinguishing directional improvements from statistically supported conclusions.
6. A/B Testing & Business Decision-Making
Evaluated Experiment 2, Product Recommendation Layout, using user-level assignments and multiple business performance metrics.
Analytical Techniques:
Control vs. Treatment comparison
Primary and secondary KPI evaluation
Absolute and relative uplift calculations
Downstream conversion monitoring
Statistical uncertainty assessment
Business impact evaluation
Experiment-driven recommendations
Key Applications: Assessing whether changes in product engagement were accompanied by improvements in purchase conversion and revenue.
7. Reporting & Business Recommendations
Integrated findings from SQL Server, Python, Power BI, and Tableau into a structured analytical workflow.
Deliverables:
Relational database and data model documentation
SQL-based behavioral and conversion analysis
Root cause investigation
A/B testing evaluation
Power BI executive and conversion dashboards
Tableau experiment performance dashboard
Business recommendations and portfolio documentation
Outcome: Delivered an end-to-end e-commerce analytics case study demonstrating the ability to transform raw transactional and behavioral data into measurable insights, evaluate potential improvements, and support data-driven business decisions.
Link:
Thank you so much for reading my project. I will be happy to receive your feedback and opinion about the project.
Link to Project Post on LinkedIn