This project was created using Python. In this project, I used various tools such as:
(Using: Code, Library, Data Cleaning, Functions, Variables, Operations, Charts)
Title:
Car exhibition
Project Overview:
Summery:
To do this project, I used the CarPrice_Assignment, Which includes technical and specialized information on several types of cars along with their prices. I extracted the data from the Kaggle site. In fact, This project is based on a fictional car exhibition. The existing database has several files in CSV format and contains information about the technical and appearance details of several car models in a car exhibition. Analyzing this information, along with the prices of the cars, can help the salesperson to introduce the best option to the customer and also help the customer to make the right choice for buying a car.
Using Python software allows us to analyze the overall status of the car exhibition and present a picture of a suitable purchase to the customer using the extensive Python library package and the desired functions and formulas.
Database:
Database contains the entities below:
There is one CSV file “CarPrice_Assignment” whose fields and records are as follows:
26 fields & 205 records
car_ID: Unique id of each observation (interger)
Symbolling: Its assigned insurance risk rating, A value of +3 indicates that the auto is risky, -3 that it is probably pretty safe. (Categorical)
CarName: Name of car company. (Categorical)
Fueltype: Car fuel type i.e. gas or diesel. (Categorical)
Aspiration: Aspiration used in a car. (Categorical)
Doornumber: Number of doors in a car. (Categorical)
Carbody: Body of car. (Categorical)
Drivewheel: Type of drive wheel. (Categorical)
Enginelocation: Location of car engine. (Categorical)
Wheelbase: Wheelbase of car. (Numeric)
Carlength: Length of car. (Numeric)
Carwidth: Width of car. (Numeric)
Carheight: Height of car. (Numeric)
Curbweight: The weight of a car without occupants or baggage. (Numeric)
Enginetype: Type of engine. (Categorical)
Cylindernumber: Cylinder placed in the car. (Categorical)
Enginesize: Size of car. (Numeric)
Fuelsystem: Fuel system of car. (Categorical)
Boreratio: Boreratio of car. (Numeric)
Stroke: Stroke or volume inside the engine. (Numeric)
Compressionratio: Compression ratio of car. (Numeric)
Horsepower: Horsepower. (Numeric)
Peakrpm: Car peak rmp. (Numeric)
Citympg: Mileage in city. (Numeric)
Highwaympg: Mileage on highway. (Numeric)
Price: Price of car. (Numeric)
Questions & Goals:
1-Does the existing database have duplicate data or NaN?
2-How does the type of engine affect the price of a car?
3-How does the price of a cylinder affect the price of a car?
4-What is the average price of cars with an ohcv engine type?
5-What is the average price of cars based on engine type?
6-What is the average price of cars based on the number of cylinders?
7-How much does a car’s maximum engine speed (peak rpm) affect citympg and highwaympg?
8-How do you check the numerical correlation between them?
9-Scatterplot analysis of peak rpm and citympg
10-Scatterplot analysis of peak rpm and highwaympg
11-Regression Plot between peak rpm and citympg & highwaympg.
12-Bar chart that shows the names of 20 cars with the average numerical values of weight, length, width, and height, and aggregates the data.
13-Pie chart of the overall average of the top 5 cars.
14-Bar chart analysis of car names with symbolling
15-Bar chart analysis for dividing and labeling cars based on the actual price distribution into three groups: Economy, Medium, and luxury.
16-What percentage of cars with the Medium label based on the Doornumber column have two doors?
17-If a customer wants to buy a Medium car that meets the following requirements, which car would you recommend? It should be light weight, low fuel consumption, have two doors, have high engine power, and be priced around 20,000.
18-If a car with the stated conditions cannot be found, what would be the closest alternative, for example, a car that is slightly more expensive or has a slight difference in weight?
19-Choosing the top three cars based on desired features.
20-The bar chart of comparing the top three cars and comparing their weight, power, and price?
Steps:
Using data from a hypothetical car exhibition in CSV format extracted from the Kaggle website and a Python program, I was able to provide a concise analysis of the cars available. At first step, I cleaned the data using Python. Next, I wrote some code to compare technical and price points. Finally, I drew the relevant graphs and identified the top cars from the customer’s perspective.
Data Cleaning:
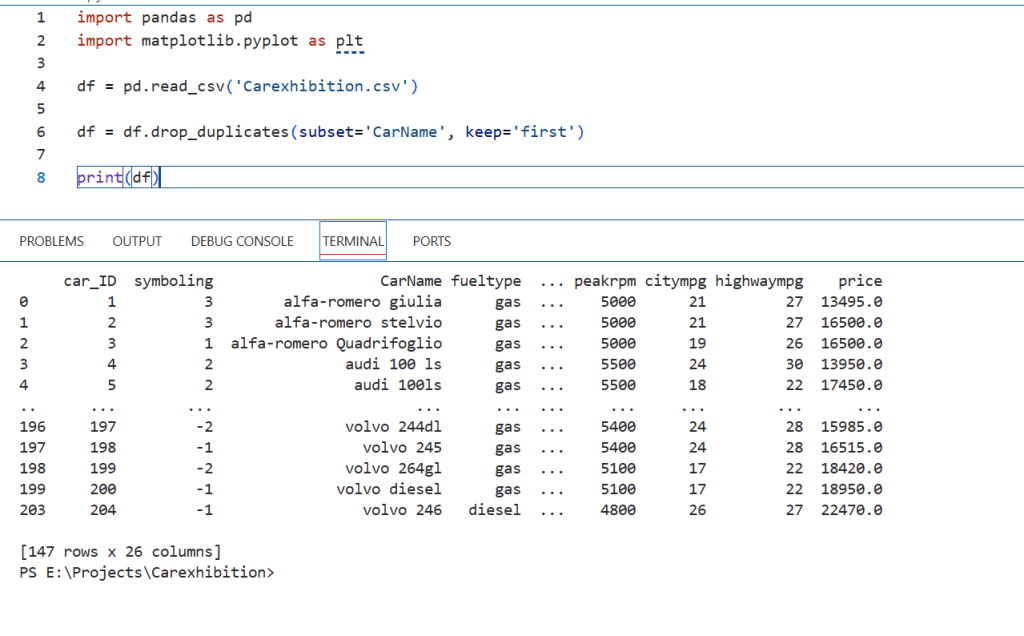
-Remove duplicate names:
pic 1
A set of tabulated forms is presented that removes and presents duplicate information. This duplicate information has been identified and removed based on the name of the cars.
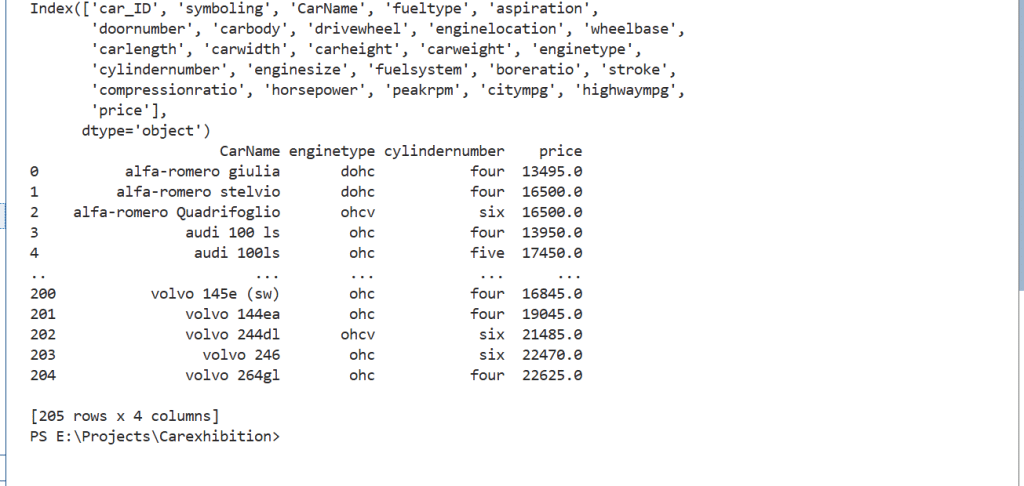
-Finding and removing Nan:

pic 2
pic 3
From a general perspective, it is quite clear that the system did not find an empty row and there were no Nans.
Analysis:
After preparing and cleaning the data, I need to code using Python to answer the questions and objectives.
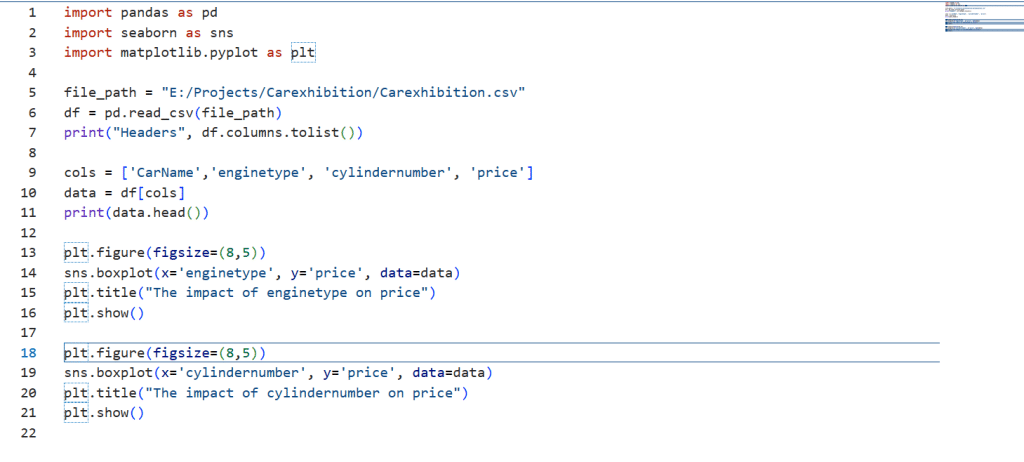
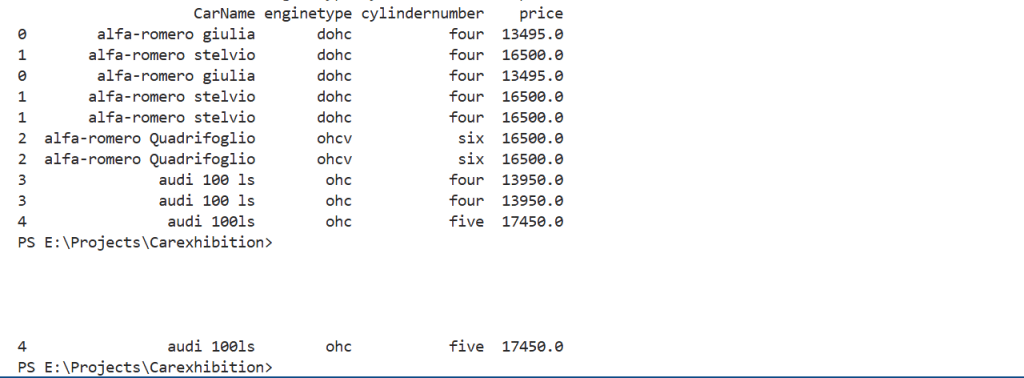
-Analysis of the impact of enginetype and cylandernumber on the price of a car:
pic 4
pic 5

figure 1

figure 2
The result shows that the “dohcv” engine type has the highest price range, while The “ohc” type engine has the lowest price, under $10,000. The charts show that although the more cylinders, the higher the price, but a 4-cylinders car is less expensive than a 2-cylinders car. This can be related to technical issues and the type of car. Overall, the highest price is for the “dohcv” engine with the number of 8-cylinders and the lowest price is for the “ohc” engine with the number of 4-cylinders. However, this is not a definitive conclusion and depends on other options. For example, the Alfa-Romero Quadrifoglio with an “ohcv” engine six-cylinders costs $16,500, while the Alfa-Romero Stelvio with a “dohc” engine four-cylinders costs the same. It seems that in this comparison, the impact of engine type is greater.
-Average price of cars with an “ohcv” engine type & average price of cars based on engine type:
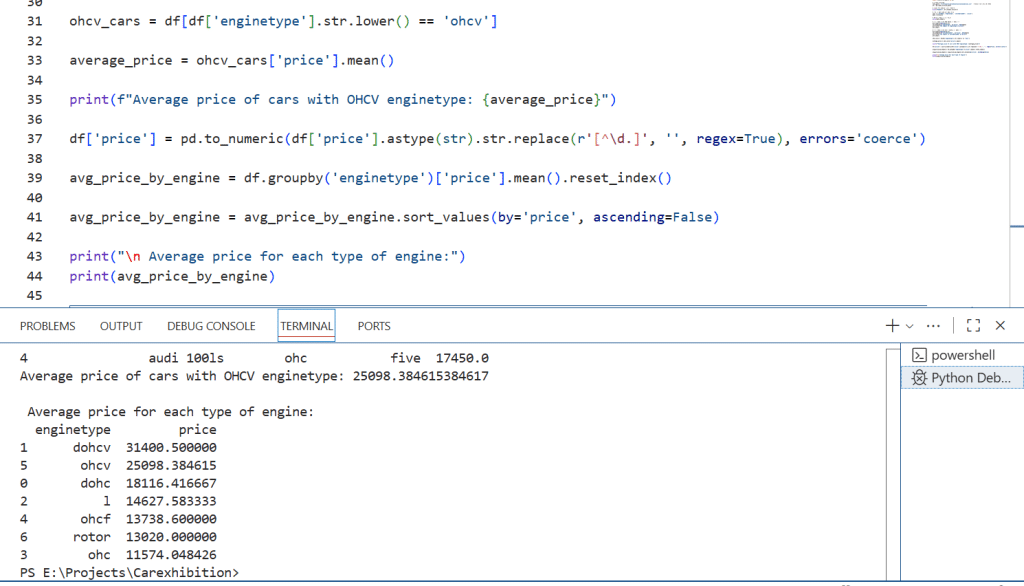
pic 6
Therefore, according to the result of pic 7 obtained, which is designed in a descending manner, the average price of cars with an “ohcv” engine type is approximately $25,098. The average of the car with other engine types can also be seen, which is $11574 in the lowest case for “ohc” and $31400 in the highest case for “dohcv”.
-Average price of cars based on the number of cylinders:
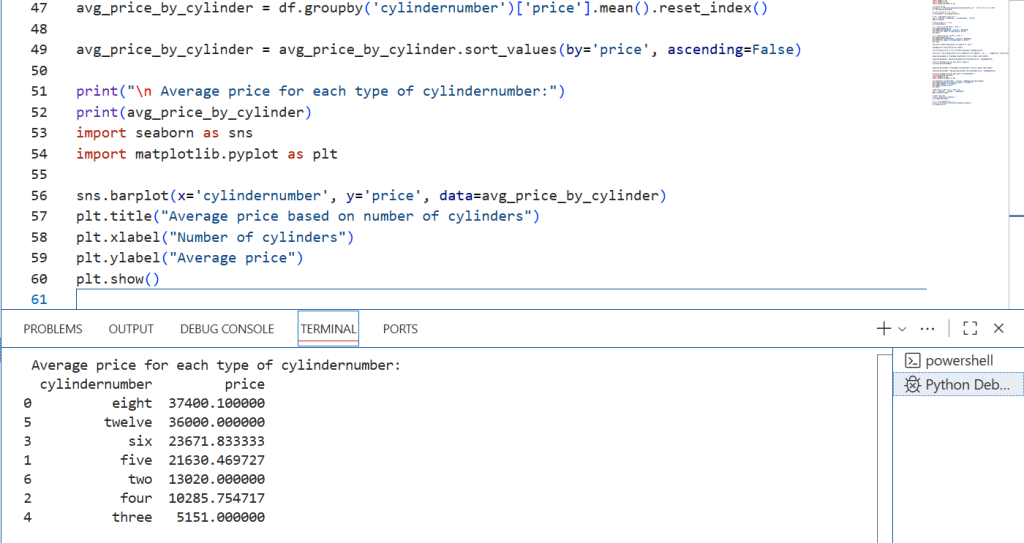
pic 7
According to the results obtained, which are designed in a descending order, the average price of cars with eight cylinders is $37,400 at the highest average level, while the average lowest price level for cars with three cylinders is $5,151.

figure 3
Given is a bar graph providing comprehensive information on average price, based on the number of cylinders, ranging from over $5,000 to over $35,000. Looking an overall perspective, it is starkly apparent that, the cars with eight cylinders have a higher average price, in the upper $35,000 range, while two-cylinders cars have an average of approximately under $5,000. But as mentioned earlier, there are exceptions to this conclusion.
-Car’s maximum engine speed (peak rpm) affect citympg and highwaympg:
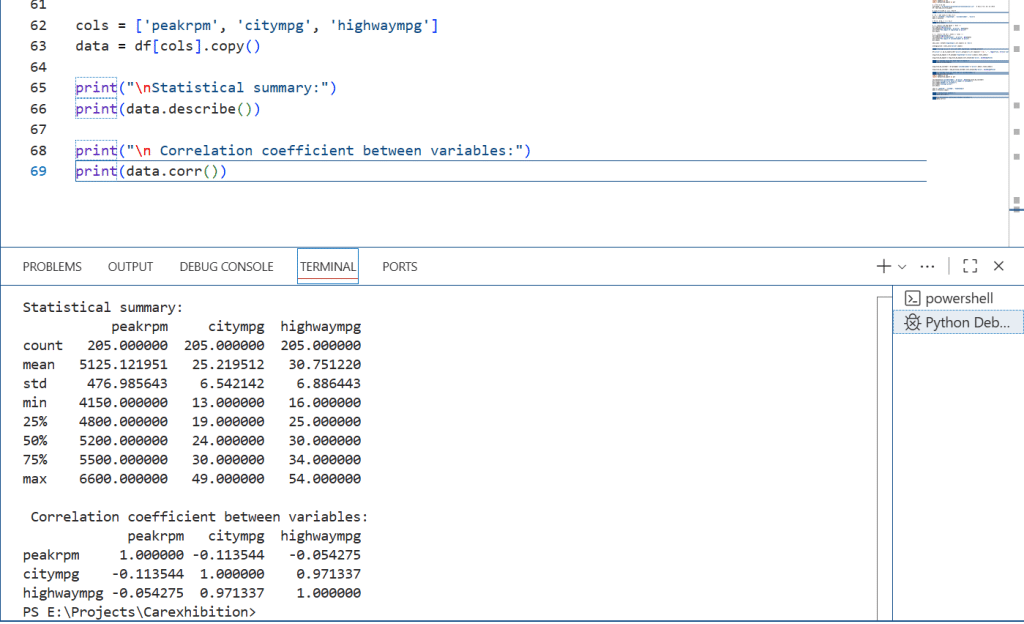
pic 8
The Peakrpm range (from 4150 to 6600) shows that there is a wide variation in the maximum engine speed of cars. Citympg and highwaympg are also quite variable (from 13 to 49 in the city and from 16 to 54 on the highway), indicating a large difference between fuel-efficient and fuel-efficient cars. The output shows the engine speed and distance traveled in the city and highway in the first, second, and third quartiles.
In this section, I also used the correlation matrix. The obtained output can be analyzed as follow:
-Relationship between Peakrpm and citympg
-Correlation value: -0.113
-Analysis: There is a very weak and negative relationship.
That is, as the maximum engine speed increases, the distance traveled in the city decreases slightly, but the effect is very small.
-Relationship between Peakrpm and highwaympg
-Correlation value: -0.054
-Analysis: This is also negative and very weak.
That is, high engine rpm has almost no significant effect on highway performance.
-Relationship between citympg and highwaympg
-Correlation value: 0.971
-Analysis: This relationship is very strong and positive.
Naturally, a car that gets good fuel economy in the city will perform similarly on the highway.
Peakrpm has very little effect on fuel economy. Cars with higher engine speeds will use slightly more fuel, but this effect is negligible.
City and highway fuel consumption: The very high correlation shows that the fuel consumption behavior of cars in the city and on the highway is very similar.
Increasing engine speed usually means a more powerful engine, but it doesn’t necessarily mean less fuel efficiency other factors (such as weight, engine size, transmission type) may have a greater impact.
-Scatterplot analysis of peak rpm and citympg & Scatterplot analysis of peak rpm and highwaympg:

pic 9

figure 4

figure 5
In most real-world car data, increasing peak rpm is usually accompanied by decreasing citympg and highwaympg. Cars with higher engine rpm usually get better fuel economy, but there are always exceptions.
By adding a Regression Plot, we can also see the trend line between peak rpm and fuel consumption (citympg, highwaympg). It means, we can understand exactly whether increasing engine speed increases or decreases mileage.
-Regression Plot between peak rpm and citympg & highwaympg:

pic 10

figure 6
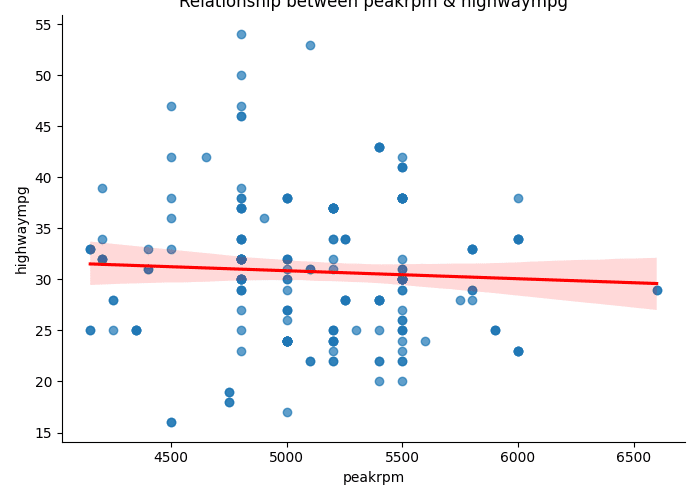
figure 7
Two regression plots are displayed. The first is the relationship between Peakrpm and citympg, and the second is the relationship between Peakrpm and highwaympg. The supplied line graph provides comprehensive information regarding the regression line and the average trend of the data. From an overall perspective, it can be inferred that the Peakrpm display the same figures at the beginning and the end, despite wild fluctuations in the middle.
A closer look at the infographic shows ,there was a slight fall that as engine speed increases, mileage decreases and fuel consumption increases. Following a similar pattern, there was a slow increase and followed by stabilization in between 5000 to 5500 smoothly. It indicates that as the engine speed increases, mileage increases and efficiency improves.
-The Bar chart that shows the names of 20 cars with the average numerical values of weight, length, width, and height, and summarize the data.
To display the weight, length, width, and height specifications of 20 cars, we first take the average of the numbers and then aggregate the data to remove duplicate data.

pic 11

pic 12
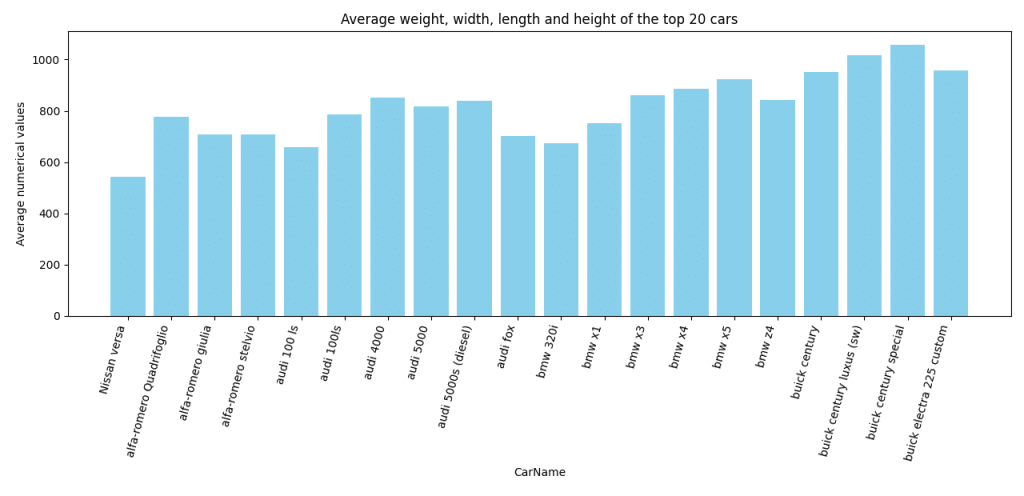
figure 8
The bar chart illustrates the disparities in the average carry out various around on the numerical values (weight, width, lenghth and height) that the top 20 cars have in the car exhibition. From an overall perspective, it is quite clear that Nissan versa has the lowest average and buick century special has the highest average.
when scrutinized more rigorously, regarding the types of cars, it can be discerned audi4000 and Audi 5000s (diesel) compared to approximately are similarly with bmwx3 and bmwx4. In the same vein, the bmwx5, Buick century, and Buick Electra 225 Custom are in similar conditions.
Following a different trend, alfa Romeo giulia, alfa Romeo stevia, audi100ls, Audi fox, bmw32oi and bmwx1 are at about the same level and have an average value of less than 800, While BMW X5 and Buick models are above 800.
-Pie chart of the overall average of the top 5 cars.
In this section, we want to draw a pie chart which selects the 5 cars that have the highest average in terms of (weight, length, width, and height) and measure the ratio of their average contribution to the average of the entire data. In this way, it is determined what contribution each one has to the overall average.
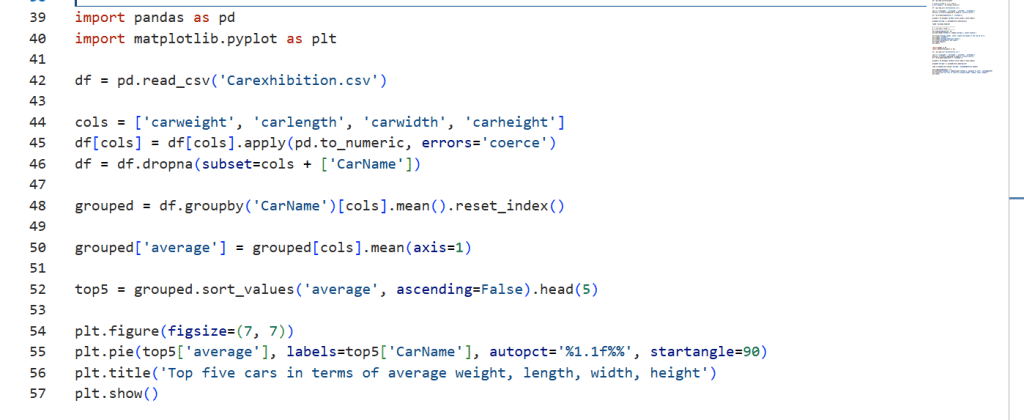
pic 13
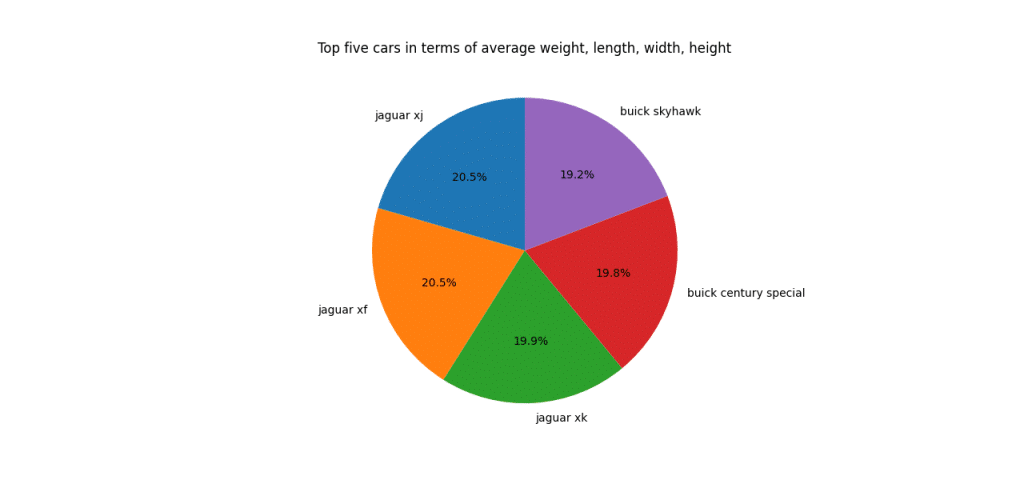
figure 9
The pie chart compares the proportion of average weight, length, width and height of top five cars. overall, it is starkly apparent that the greatest increase and decline were in percentage of jaguar xj and jaguar xf to jaguar xk, Buick century special and Buick Skyhawk correspondingly. A more rigorous scrutiny at the pie chart reveals that, the most popular cars were jaguar xj and jaguar xf, representing almost of a fifth of all registrations. At 19.9%, jaguar xk was the second most appealing car. Less significant change was evident in the two remaining cars, among Buick century special and Buick Skyhawk remained in the doldrums at approximately 19.8% and 19.2%. In total, the five selected cars have the same percentages, with a slight difference.
-Bar chart analysis of car names with symbolling
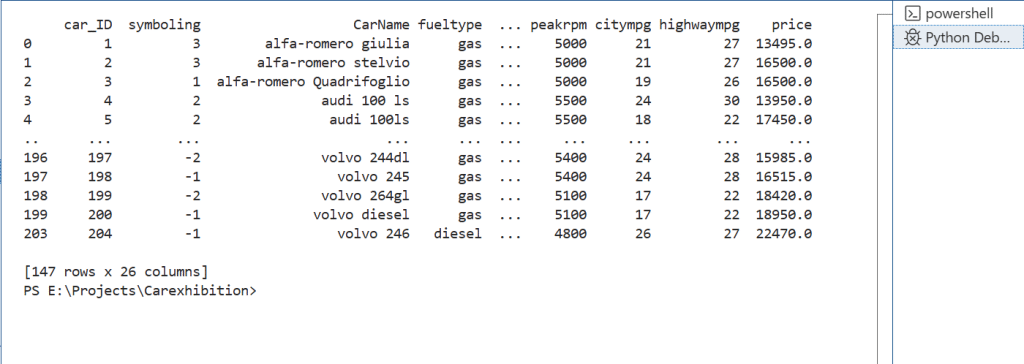
I want to draw a bar chart where the horizontal bar displays the car name and the vertical bar displays the symbolling. The symbol is insurance risk rating assigned to vehicles. Its value varies between +3 and -3. +3 indicates that the vehicle is high risk and -3 indicates that it is probably completely safe. Because the number of cars is large, we will select and examine 15 cars for better readability of the chart.
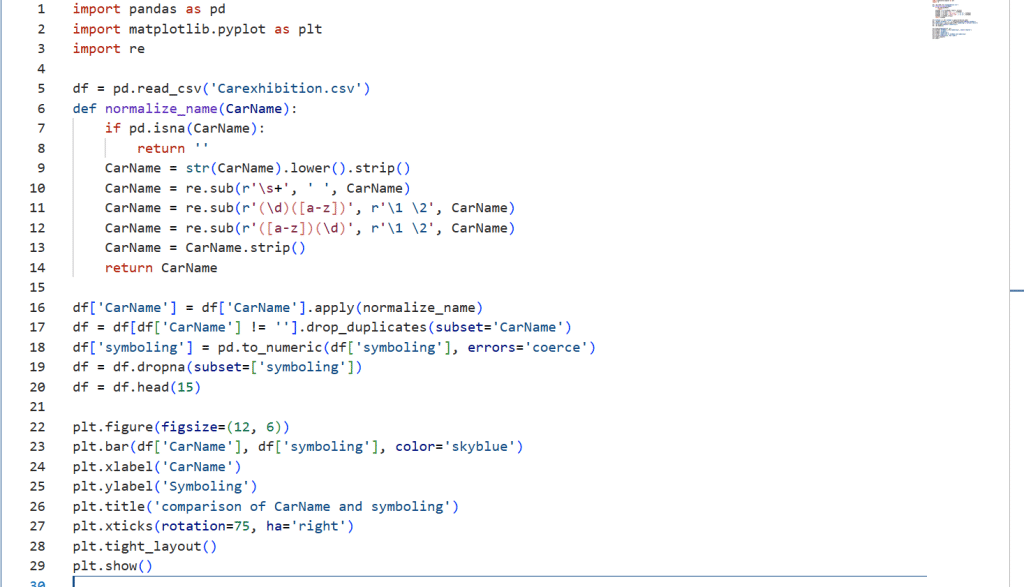
pic 14
pic 15
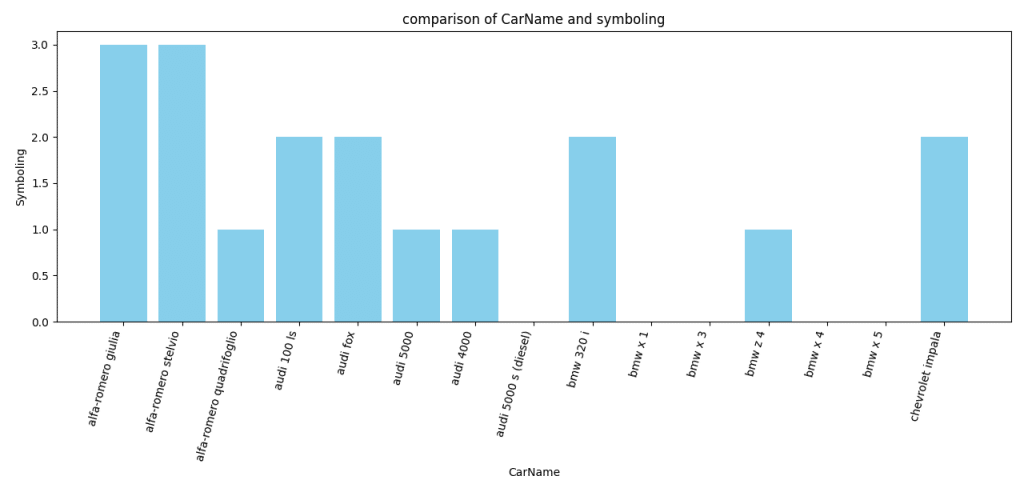
figure 10
Symbolling data usually indicates the insurance risk of a vehicle, or its riskiness in terms of accident and insurance cost. The detailed explanation of symbolling numbers is as follows:
–2 Very low risk / Low risk
-1 Low risk / Low risk
0 Moderate / Normal
1 Slightly Dangerous / Slightly Risky
2 High Risk / High Risk
3 Very High Risk / Very High Risk
So when the symbolizing column has a number of +3, it means:
-The car has a high insurance risk
-The cost of insurance for this car is probably higher
-Usually, cars with a +3 are sports or powerful cars that are more likely to suffer damage or loss in an accident.
The supplied bar chart provides comprehensive information regarding the insurance risk in the symbolling of 15 chosen cars. overall, it is clearly evident that the two cars (alfa Romeo giulia and alfa Romeo stevia) reached a climax risk dramatically to +3. A closer look at the infographic shows that the amount of insurance risk in second highest were for Audi 100 ls, Audi fox, bmw320 I and Chevrolet impala approximately +2 compared to the others. The figure for alfa Romeo quadnifoglio, Audi 5000, Audi 4000 and BMW z 4 experienced a suddenly decrease to +1. This is while other cars, including the Audi 5000 S (diesel), BMW X1, BMW X3, BMW X4, and BMW X5, have low insurance risk and their symbol were negative downward movement.
–Bar chart analysis for dividing and labeling cars based on the actual price distribution into three groups: Economy, Medium, and luxury.
Assume the price column is numeric (e.g. in Dollars or Euros). We can specify ranges, for example:
Below 10,000 → Economic
Between 10,000 and 20,000 → Medium
Above 20,000 → luxury
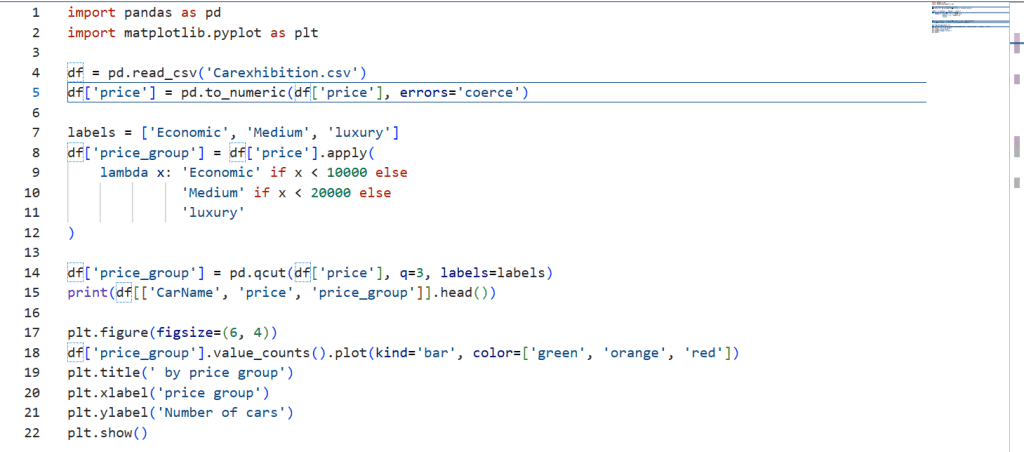
We want to divide cars into three groups based on the price column: ” Economy “, ” Medium “, and ” luxury ” and assign a label to each car.
pic 16

pic 17
The output displays the first few rows of the data table. We want to automatically determine the price ranges based on the actual data (for example, by dividing the data into three equal parts). In this case, the groups will be more accurate and fit the actual data. We divide cars into three groups based on the actual distribution of prices, that is, not by fixed numbers, but by how prices are distributed in the data. For better identification, we have defined the bar chart columns in three colors: green, orange, and red. Each column represents a type of label.

figure 11
when scrutinized more rigorously, regarding 3 groups of cars, it can be discerned that they stayed constant in number. In other words, their number in each group reached a plateau. In this way, we have divided the price column into 3 equal parts in terms of the number of cars.
For example, if the cheapest car is $5,000 and the most expensive is $40,000, the following ranges might be made:
Economy → $5,000 to $12,000
Medium → $12,000 to $22,000
luxury → $22,000 to $40,000
-What percentage of cars with the Medium label based on the Doornumber column have two doors?
We want to know what percentage of cars in the “medium” price range have two doors.

pic 18

pic 19
The output of this code shows us that 69 number of the total cars fall into the medium group, of which 27 number are two-door. Thus, 39.13 % of the total number of medium group cars have two doors.
-If a customer wants to buy a Medium car that meets the following requirements, which car would you recommend? It should be light weight, low fuel consumption, have two doors, have high engine power, and be priced around 20,000.
The conditions for choosing a car from the “medium” price group are quite clear.
We want to find a car that has the following characteristics:
In the medium price group (price_group == medium)
It has a low weight (weight less than average)
Gasoline fuel type (fueltype == ‘gas’)
It has two doors (doornumber == ‘two’)
The engine power (the horsepower column) is high
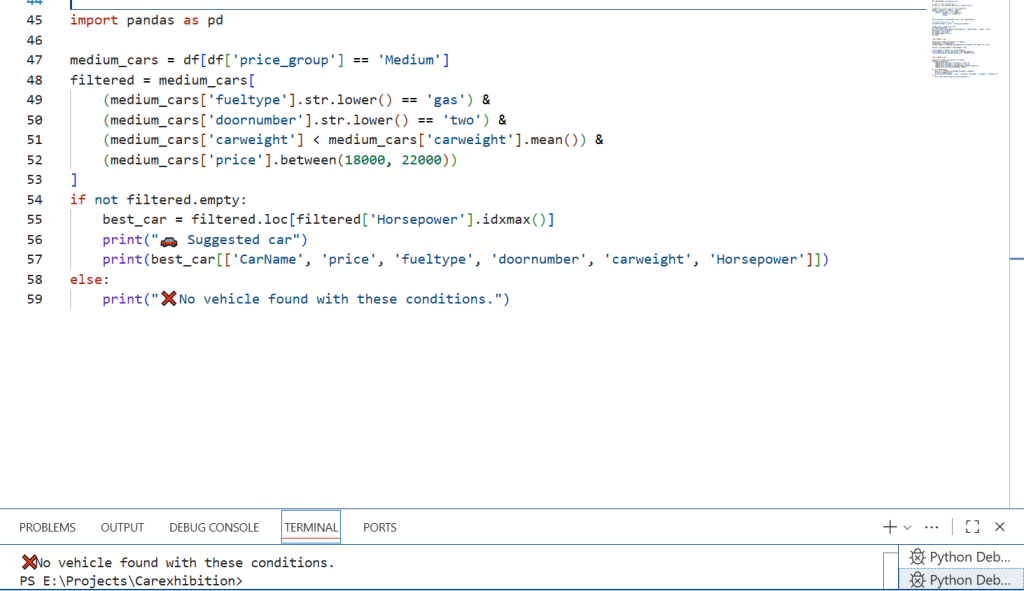
Price around 20,000.
pic 20
That means the price will be around $20,000 and the car will have the most powerful engine. The output shows that no car with the requested features is available. So we need to check for other conditions.
-If a car with the stated conditions cannot be found, what would be the closest alternative, for example, a car that is slightly more expensive or has a slight difference in weight?
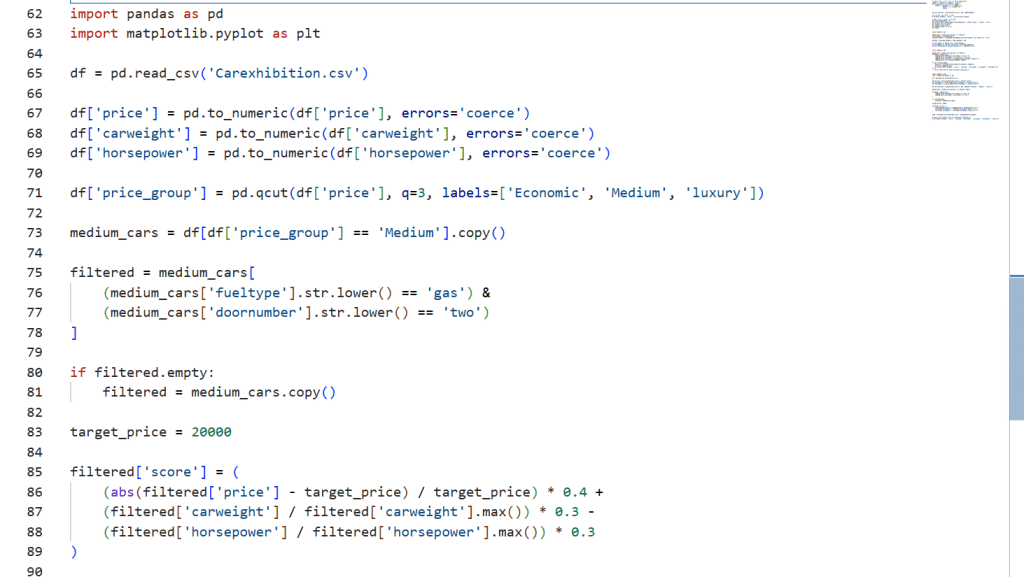
If no car meets all the exact requirements, we can find similar cars or the closest alternatives; that is, cars that most closely match the desired conditions (such as close price, low weight, gasoline fuel, two doors, high engine power, and medium group).
pic 21
-Choosing the top three cars based on desired features.
pic 22
Each car gets a score:
Price closer to 20,000 → better score (weight 0.4)
Lower weight → better score (weight 0.3)
More power → better score (weight 0.3)
The cars are then sorted by score from best to worst.
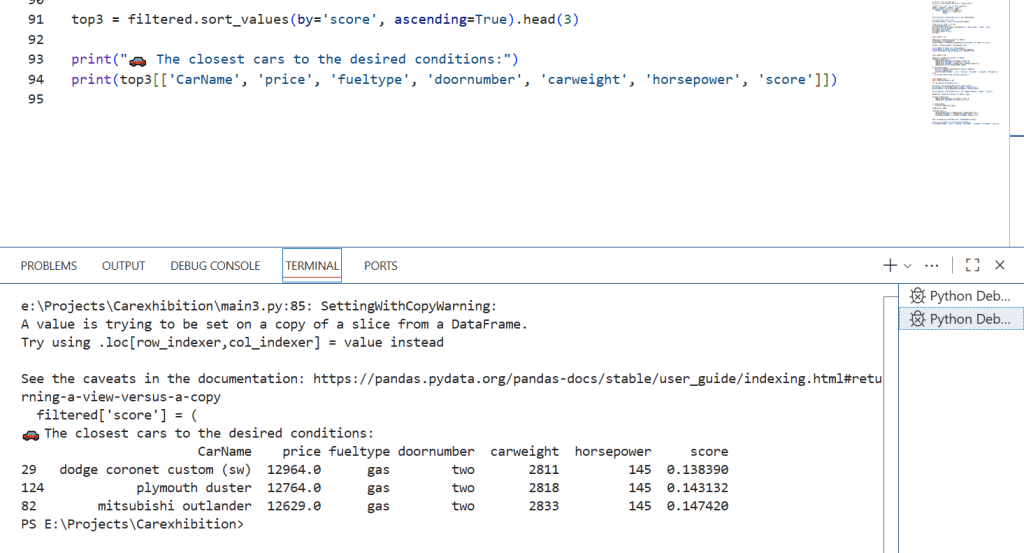
The first three cars (with the lowest scores) are the closest options to the conditions.
The result introduces the following three cars, respectively from lowest score to highest score :
dodge coronet custom (sw) at a price of $12,964, plymouth duster at a price of $12,764, mitsubishi outlander at a price of $12,629.
-The bar chart of comparing the top three cars and comparing their weight, power, and price?
After finding 3 cars that meet the desired conditions, we draw a comparative bar chart to visually see the difference in weight, engine power, and price between them.

pic 23
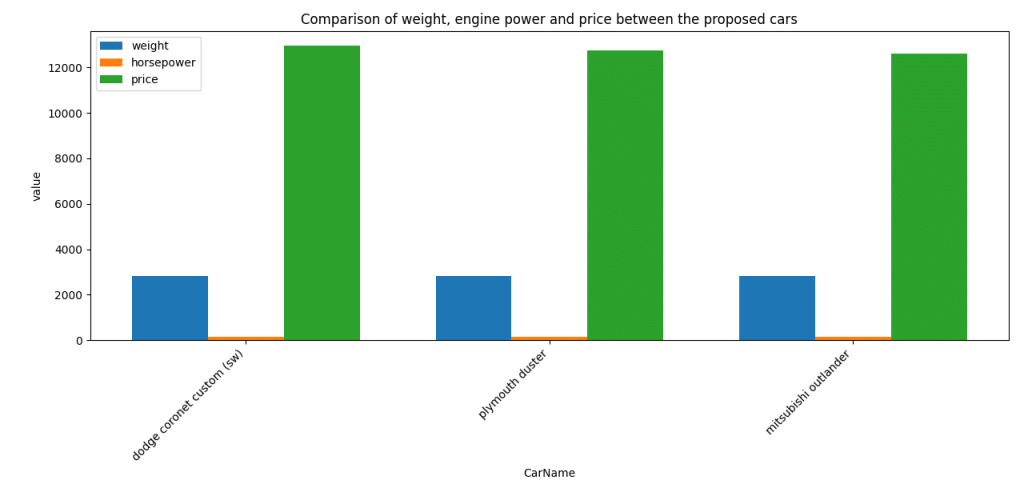
figure 12
The bar chart illustrates a comparison of the differences in weight, engine power, and price across the top three cars. Overall, it is apparent that the price and weight of three top cars with a slight difference were in much the same way. Additionally, following a similar pattern the horsepower of them were as well as each others.
Key points:
- There was no duplicate data or NaN in the existing database.
- The highest price is for the “dohcv” engine with the number of 8-cylinders and the lowest price is for the “ohc” engine with the number of 4-cylinders.
- The number of cylinders is not the reason for the high price of the car and depends on other options.
- It seems that comparing engine type and number of cylinders, the impact of engine type is greater.
- The average price of cars with eight cylinders is $37,400 at the highest average level, while the average lowest price level for cars with three cylinders is $5,151.
- the average price, based on the number of cylinders, ranging from over $5,000 to over $35,000.
- There is a very weak and negative relationship between peakrpm and citympg.
- This is also negative and very weak between peakrpm and highwaympg.
- This relationship is very strong and positive between citympg and highwaympg.
- Peakrpm has very little effect on fuel economy.
- The very high correlation shows that the fuel consumption behavior of cars in the city and on the highway is very similar.
- Increasing engine speed usually means a more powerful engine, but it doesn’t necessarily mean less fuel efficiency other factors (such as weight, engine size, transmission type) may have a greater impact.
- Increasing peak rpm is usually accompanied by decreasing citympg and highwaympg. Cars with higher engine rpm usually get better fuel economy, but there are always exceptions.
- The regression plots shows that Where the graph is downward sloping, it indicates that as engine speed increases, mileage decreases and fuel consumption increases. Where the graph is upward, it indicates that as the engine speed increases, mileage increases and efficiency improves.
- Nissan versa has the lowest average and buick century special has the highest average.
- The most popular cars were jaguar xj and jaguar xf, representing almost of a fifth of all registrations.
- The two cars (alfa romeo giulia and alfa romeo stelvio) reached a climax risk dramatically to +3.
- The Audi 5000 S (diesel), BMW X1, BMW X3, BMW X4, and BMW X5, have low insurance risk and their symbol were negative downward movement.
- 3 groups of cars (Economy, Medium, and luxury), it can be discerned that they stayed constant in number.
- 69 number of the total cars fall into the medium group, of which 27 number are two-door. Thus, 39.13 % of the total number of medium group cars have two doors.
- The top three cars, in order from lowest to highest score, that are in the medium category, have two doors, have high engine power, and weigh less, are: dodge coronet custom (sw) at a price of $12,964, plymouth duster at a price of $12,764, mitsubishi outlander at a price of $12,629.
- It is apparent that the price and weight of three top cars with a slight difference were in much the same way. Additionally, following a similar pattern the horsepower of them were as well as each others.
Results & Recommendations:
- It seems that having an intelligent system for displaying vehicle specifications is essential. This system can make an effective contribution to improving buyer knowledge.
- The advertising budget can be increased so that each car is introduced with diagrams and technical details.
- Although having a catalog of each car can be effective, it seems necessary to have large monitors for each car company separately at the showroom to display the technical details and performance of the cars.
- Catalogs can be prepared to provide buyers with a comparison of the price and performance of each company’s vehicles. These catalogs can include comparison charts.
- By displaying videos and advertisements of cars on car showroom monitors and the type and number of purchases of each car model by buyers, data can be obtained on buyer tastes and preferences and future purchases can be predicted.
Action:
In this project, I used simple libraries, codes and functions to get my answers:
Libraries: Pandas, Matplotlib, Matplotlib.pyplot, Seaborn
Codes: average, mean, percent, filtered.
Functions: df, new_df.notnull, pd.read_csv.
Link:
Thank you so much for reading my project. I will be happy to receive your feedback and opinion about the project. If this project is useful for you, click on this link:
Link to project repository on GitHub
Link of CSV Northwind Database on Kaggle
