
This project was created using Excel. In this project, I used various tools such as Data visualization, Dashboard, Data cleaning, Formulas, Pivot, Forecast, Regression, and Conditional Formatting.
Title:
Canadian Tourist Visa for Iranians in (2022-2024)
Project Overview:

Pic 1
Summery:
I was a member of a persian telegram group. The members of this group were Iranians who were Canadian tourist visa applicants who were in the process of receiving their visas. These people put the result of visa acceptance or refuse in the group by mentioning their conditions. I collected data related to 150 cases and 1303 visa applicants and put them in an Excel file. The time frame for this data was from January 2022 to January 2024. If people announced their results before and after this date, they are not included in this statistic.
Applicants had features that affected whether or not they received a visa. They were stressed about how much these features affect the result of getting a visa?
The table I designed is based on these features: having an invitation, having a Schengen visa, a history of Canadian visa refusal. Also, I collected the information of applicants’ conditions in terms of gender and the number of visa applications in one file. Which were:
“Man”, “Woman”, “Couple”, “Man and Child”, “Woman and Child”, “Family”.
To create this table, I checked different forms in several sheets and finally I found table Pic 1 suitable for analysis, in which I entered the details of the applicants month by month from January 2022 to January 2024. All numbers are numerical variables and represent numbers.
In this project, the dependent variables are visa results (approve or refuse) and I initially considered the independent variables as invitation, Schengen, and previous refusal to check the effect of each factor on receiving or not receiving a visa.
In addition, to check how the conditions of the applicants in terms of gender and the number of applicants have an effect on receiving a positive or negative result, in the second stage; I considered gender and number of applicants as independent variables.
Also, according to the information on Approved visa in this period of time, is it possible to predict how the process of receiving or not receiving a visa will be in the following months?
Dependent variable (Y) = Approve, Refuse
First stage: Independent variable (X) = Invitation, Schengen, and Previous Refusal
Second stage: Independent variable (X) = “Man”, “Woman”, “Couple”, “Man and Child”, “Woman and Child”, “Family”.
This project has five parts:
1-Data cleaning
2-The first part: Investigation and influence of features on Visa results.
3-The second part: Investigation and influence of gender and number on Visa results.
4-Dashboard & Pivot
5-Forecast
I created the database in three separate sheets and in different tables. The contents of fields and records are the same, but columns have been added or subtracted and the shape of the tables is different.
Categorized 3: The table of this sheet has 176 columns and 8 rows.
Categorized 4: The table of this sheet has 21 columns and 8 rows.
Categorized 5: The table of this sheet has 6 columns and 151 rows.
Features: Characteristics of applicants.
Man: Number of male applicants.
Woman: Number of female applicants.
Couple: The number of applicants who applied as husband and wife.
Man & Child: The number of applicants who applied as father and child.
Woman & Child: The number of applicants who applied as mother and child.
Family: The number of applicants who applied as a family.
Total (Vertical): Sum of the number of each column or field.
Date: Month and year of visa result.
Invitation: Number of invitations per applicant.
Schengen: Number of Schengen visas per applicant.
Previous Refusal: The number of times a visa is refused for each applicant.
Approve: Positive visa result.
Refuse: Negative visa result.
Total (Horizontal): The number of approved or refused people in each record.
Approve 2022: Total number of approved visas in 2022.
Refuse 2022: Total number of Refused visas in 2022.
Approve 2023: Total number of approved visas in 2023.
Refuse 2023: Total number of Refused visas in 2023.
Change% Approve: Percentage of changes in the number of approved visas.
Change% Refuse: Percentage of changes in the number of Refused visas.
Total Approve%2022: Percentage of approved visas in 2022.
Total Refuse%2022: Percentage of Refused visas in 2022.
Total Approve%2023: Percentage of approved visas in 2023.
Total Refuse%2023: Percentage of Refused visas in 2023.
Features Approve%2022: The percentage of approved visas of a Feature divided by the total number of the same Feature in 2022.
Features Refuse%2022: The percentage of Refused visas of a Feature divided by the total number of the same Feature in 2022.
Features Approve%2023: The percentage of approved visas of a Feature divided by the total number of the same Feature in 2023.
Features Refuse%2023: The percentage of Refused visas of a Feature divided by the total number of the same Feature in 2023.
Invitation 2022: Number of invitations applicants in 2022.
Schengen2022: The number of Schengen visa applicants in 2022.
Previous Refusal 2022: The number of previously refused visas of applicants in 2022
Invitation 2023: Number of invitations applicants in 2023.
Schengen2023: The number of Schengen visa applicants in 2023.
Previous Refusal 2023: The number of previously refused visas of applicants in 2023.

Pic 2
According to Pic 2, the two yellow columns under the main table are the total number of approved and refused visas in each record in 2022 and 2023.
Questions & Goals:
1-Data cleaning and creating categories.
2-The effect of independent variables (invitation letter, Schengen, history of refusal) on the dependent variable.
3-The results of changes Canadian tourist visa for Iranian applicats between Jan 2022, Jan 2023 and Jan 2024.
4-Visa application results for two consecutive years 2022 to 2024.
5- Comparison of the number of applicants from 2022 to 2023.
6-The average of Canadian tourist approved visas for Iranian applicats comparation in different situation.
7-Comparison the number of approved and refused visas in the years 2022 and 2023 for different groups.
8- Comparison of the number of applicants of “Man” and “Woman” from 2022 to 2023.
9-Average of approved and refused in 2022 to 2023.
10-Percentage changes Canadian tourist approved visas for Iranian in all categories between 2022 and 2023.
11-Forecasting this trend for the coming months.
Steps:
1-Data cleaning:
At first, because of the data was raw and scattered and needed to be cleaned and organized, I first created different types of tables in different sheets and finally designed a table categorized 3 sheet.
-Data cleaning and creating categories.
Categorized 3: According to Pic 1, I showed the information of the years 2022 and 2023 month by month. As of 2024, only January data was available.
Categorized 4: According to Pic 2, I added the calculation fields in which the percentage of approved and refused visas in 2022 and 2023 are shown. In addition, I calculated the percentage of changes in receiving visas in these two consecutive years.
Categorized 5: According to Pic 3, In order to check the visa process and predict the future, in this sheet I placed the date column vertically and below from January 2022 to January 2024, and I also created the previous invitation, Schengen and Previous Refusal fields vertically in the same order and the results I entered next to them.

Pic 3
2-Regression:
Categorized 6: According to Pic 4, I created a model and checked the effect of independent variables (invitation letter, Schengen, history of refusal) on the dependent variable of the result of receiving a visa through regression. I will fully analyze this model in the analysis section.
Conditional Formatting: Using this tool, the factors that have a greater impact on Result of visa are displayed in green and the factors that have less impact on Result of visa are displayed in red.
3-Dashboards: First, I compared different variables through a pivot table, and after drawing the corresponding graphs, I created two dashboards, the full explanation of which is available in the analysis section.
4-Forecast: According to Pic 5, in this sheet, I checked the process of receiving positive or negative results in the months after January 2024. Its complete analysis is available in the analysis section.

Pic 4
Analysis:
Result of Regression:
-The effect of independent variables (invitation letter, Schengen, history of refusal) on the dependent variable
R-Square =83%: If R-Square be greater than 0.7, it is considered a good result. It means that independent variables or effective factors in Results of visa can explain up to 83% of the dependent variable or Results of visa.
F Significance = 1.002: If the value of the F Significance test is above 5%, the coefficient is not zero. If the coefficient be zero, the independent variable will be zero. This result shows us that there is a linear relationship between our variables.
Standard Error = 2.85: This means that the predicted average is 2.85 away from the actual value. If the sample size increases, the average will be closer to the true value.
Intercept = 0.92: I did not consider the width from the origin or the constant value to be zero. Because the process of getting a visa is a continuous process and it has existed since the years before this project was reviewed. That’s why the created graph is placed above the symmetry line of the center.
P-Value = (0.001, 1.107, 0.0002 and 0.25): If it is less than 5%, the coefficient is significant. When F Significance and P-Value are equal, there is only one independent variable. This model shows that the probability of these results is not zero. But since the P-value in the case of Schengen visa is less than 5%, it can be concluded that this coefficient is significant and the probability of it being a chance is very low or close to zero.
Regression Analysis, Full Professional Report
1-Overview of the Model:
The regression model demonstrates a strong predictive performance with highly significant statistical indicators. The objective was to evaluate how key factors Invitation, Schengen travel history, and Previous Refusal influence the target variable (e.g., approval probability, score, or another measurable outcome)
2-Model Fit Statistics:
Multiple R = 0.916
Indicates a very strong correlation between the independent variables and the dependent variable.
✓ R Square = 0.839
The model explains 83.9% of the variance in the dependent variable, which is exceptionally high for real-world data.
✓ Adjusted R Square = 0.835
Close to the R² value, suggesting:
The model is not overfitted.
The included variables genuinely contribute to explaining the variation.
✓ Standard Error = 2.85
On average, the model’s predictions deviate from actual values by roughly 2.85 units, which indicates acceptable precision.
✓ Observations = 150
A sample size of 150 provides strong statistical reliability.
ANOVA Significance of the Overall Model
✓ F-statistic = 254.05
✓ Significance F = 1.00 × 10⁻⁵⁷
These values indicate that the overall regression model is highly significant.
In other words, the predictors collectively explain the dependent variable far better than random chance.
Coefficient Analysis and Interpretation
Variable Coefficient P-value Interpretation
Invitation +0.4427 1.10E-18 Strong, significant positive effect
Schengen +0.3784 0.000228 Significant positive effect
Previous Refusal –0.1833 0.257 Negative but not statistically significant
Intercept 0.928 0.0014 Significant baseline value
Interpretation of Each Predictor
1-Invitation – Strongest Predictor (Positive and Highly Significant)
Coefficient: +0.44
P-value: ~0
This variable has the largest impact among all predictors.
Presence of an invitation substantially increases the predicted outcome.
This is the most influential factor in the model.
2-Schengen Travel History Significant Positive Effect
Coefficient: +0.38
P-value: 0.000228
A positive Schengen travel record is associated with a higher predicted score/outcome.
This variable is also an important and reliable predictor.
3-Previous Refusal Negative but Not Statistically Significant
Coefficient: –0.18
P-value: 0.257
Although the coefficient suggests a negative impact, the effect is not statistically different from zero at common significance levels.
Interpretation:
Past refusal might have a negative influence, but the evidence is not strong enough to conclude this with confidence.
Confidence Intervals (95%):
Invitation: [+0.3566 , +0.5287]
Schengen: [+0.1807 , +0.5759]
Previous Refusal: [–0.5018 , +0.1353]
Because the confidence interval for “Previous Refusal” crosses zero, its non-significance is confirmed.
Overall Conclusion
✔ The model is statistically strong and highly reliable.
✔ Two predictors have a clear and significant positive impact:
Invitation (most powerful determinant)
Schengen travel history
✔ Previous Refusal shows a negative trend but is statistically inconclusive.
✔ With an R² of 0.839, the model explains the majority of the outcome variability.
A visual analysis:

Pic 4-1

Pic 4-2
1-Coefficient Bar Chart, shows which variables have the strongest positive or negative impact.
2-95% Confidence Interval Plot, shows the uncertainty range for each coefficient and whether the interval crosses zero.
Both charts clearly confirm:
Invitation → strongest positive effect
Schengen travel history → significant positive effect
Previous Refusal → negative but statistically uncertain (CI crosses zero)
Dashboards:
Using categorized 3 and 4, I designed two dashboards to use the pivot tool to create charts and illustrations.

Pic 5
-The results of changes Canadian tourist visa for Iranian applicants between Jan 2022, Jan 2023 and Jan 2024.

Pic 6
The bar charts illustrate the disparities in the average of approved and refused visas, in Jan 2022, 2023 and 2024 carrying out various applicant groups. Overall, it is apparent that the average number of visa refusals increased in January 2023 compared to January 2022, and this trend continued significantly in January 2024. But the number of visa applicants also increased dramatically during these two years. A closer look at the infographic shows that, The number of visas approved for the couple group in January 2023 increased significantly compared to 2022, accounting for the highest percentage of visas received. The number of visas refused in this group is not significant. While couple group has seen a dramatically growth showing figures in the number of visas refused in January 2024, the number of visas refused is more than approved. When scrutinized more rigorously, regarding Man and Woman applicants, it can be discerned that in January 2022, the number of Woman applicants was almost double compared to Man applicants. Following a similar pattern, the number of Woman visa approvals compared to Man visa approvals. In January 2023, the number of Man applicants compared to January 2022, had an upswing. But the number of visas refused for the Man group has also boom, to the upward movement where the number is almost equal to the number of visas approved in the same group. Conversely, at the same time, the number of Woman applicants reached a plateau approximately while the number of visas refused ascended moderately. Between Jan 2023 and Jan 2024, both groups saw a culmination in the number of refusal visas swiftly. For the Man group, the number of visas refused skyrocketed, while for the Woman group, the number of visas approved and refused was almost equal.
–Visa application results for two consecutive years 2022 to 2024.

Pic 7
The bar chart provides information concerning average of approved and refused visas from 2022 to 2024. From an overall perspective, it can be inferred that the number of visas refused is higher than the number of visas approved in January 2024. This trend has been on a steep upward trend since January 2022, it should be noted that the number of applicants has increased significantly during this period and its increase at its peak reached about quadrupled.
-Comparison the number of applicants from 2022 to 2023.

Pic 8
The graph compares the number of applicant from 2022 to 2023. Overall, while all the categories surged dramatically, there was a slow increase on “Man & child” group. Under closer scrutiny, it can be revealed that, in “Woman & Child” group, saw an increase in the number of applicants almost three quarters. Thus, in the group of “Man” and “Family”, the number are almost tripled, in the group of “Women’, there are quadrupled. As a result, between 2022 and 2024, the total number of visa applicants increased on average threefold, which was an increase of 200%.
-The average of Canadian tourist approved visas for Iranian applicants comparation in different situation.
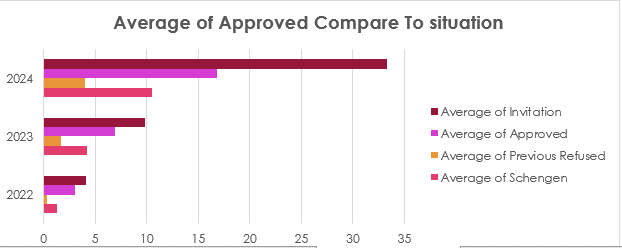
Pic 9
The bar chart illustrates the proportion of the average of approved visas compare in different situation. Overall, while the category of “invitation” was the highest impact on approving visas compared to “previous refused” category that was the lowest. A closer look at the infographic shows that from 2022 to 2024, it soared sharply. There was a sharp rise in “previous refused” category in Jan 2024. It seems that they were applicants who have applied again in 2022 and 2023.
By the timeline in the dashboard, you can see the details of changes in the time period.

Pic 10
-Comparison the number of approved and refused visas in the years 2022 and 2023 for different groups.

pic 11
Given is a bar charts comparing the total approved and refused visas by the different groups in the years 2022 and 2023. It is evident that while the number of approved visas for “Couple” group plummeted rapidly from 2022 to 2023, other groups had an upswing slowly or it levelled off.
A more rigorous scrutiny at the bar chart reveals that, the number of refused requests has increased in all groups except for “Man & Child” and “Family”. In “Family” group it rallied the approved visas to 50% and it slipped the refused visas less than a third. Simultaneously, the approved visas in “Couple” group dropped suddenly from 50% to 25% from 2022 to 2023, and then there was a slow increase on the refused visas in “Couple” group.
Between 2022 to 2023, the “Man & child” group remained stable on the number of approved visas. After that, it dropped smoothly to less than half on the number of refused visas.
-Comparison of the number of applicants of “Man” and “Woman” from 2022 to 2023.

Pic 12

Pic 13
I drew three bar charts to compare the number of visas approved and rejected between the “Man” and “Woman” groups. The bar charts depicts comprehensive information in the average of approved visas for “Man” and “Woman” groups. From an overall perspective, it can be inferred that the average of approved visas for “Woman” group was generally higher than the “Man” group. A closer look at the infographic shows that the average of approved visas of two groups soared to more than 50% between January 2022 to January 2023. So there was a sharp rise that can be as a result of increase the number of applicants to both of groups. During the period of time the number of all groups rose sharply. But comparing the “Man” and “Woman” groups, it appears that the number of “Woman” applicants has increased more than the number of “Man” applicants. Following this pattern, the number of approved visas for the “Woman” group has increased. This is while IRCC managed to maintain the proportionality of approved visas based on the intended quota.
-Average of approved and refused in 2022 to 2023.

Pic 14
The supplied bar chart provides comprehensive information regarding the average of approved and refused in 2022 to 2023. Overall, it is clear that the total number of visas approved in 2022 and 2023 roused the number of visas refused in total. At closer inspection of the graph, it is evident that the average ratio of visas refused to approved visas in 2022 is approximately one-third, while this ratio will rise to half in 2023. From 2022 to 2023, the average of applicants soared dramatically. In fact, there was a sharp rise in average of applicant and as a result the refused visas climbed significantly.
–Percentage changes Canadian tourist approved visas for Iranian in all categories between 2022 and 2023.

Pic 15
The given bar chart illustrates the changes of percentage of approved visas between 2022 and 2023 in seven different groups. In general, it is evident that in total, the percentage of approved visas slumped slightly. Additionally, there was downward movement to less than 10% in approved visas from 2022 to 2023. In terms of “Man”, “Woman” and “Family” groups, while the percentage of “Man” and “Woman” were increased about 5%, the figure for “Family” rose suddenly to 20%. Meanwhile, above 40% rise was in “Man & Child group. At the same time, the “Couple” and “Woman & Child” groups, saw more than a 10% decrease in the receipt of approved visas. The year 2023 saw a slow fall in average of approved visas in total. Although it showed a lot of fluctuation from 2022 to 2023, there was a slight downward trend.
Slicers of features can show us more details in the changes of charts.
Forecast:
To predict the Canadian tourist visa issuance process for the months after January 2024, using Categorized 5, I selected the Timeline as the Date column and considered the Approved column for the Value Range. I took the average forecast for 7 months after January 2024. The result can be seen in Pic 16.

Pic 16
-Forecasting this trend for the coming months.
The supplied line graph provides comprehensive information regarding the changes rate in approved tourist visas for Iranian applicants during a 2-year interval commencing in 2022 and to a close in 2024. From an overall perspective, it can be inferred that the approved tourist visas rate displayed approximately the same figures at the beginning and the end of the year 2022, despite wild fluctuation in the middle. It fluctuated significantly during 2023 to 2024.
A closer look at the infographic shows that the approved tourist visas rate soared to 6% at the start of 2023. There was a sharp rise from Dec 2022 to Jan 2023. It hold constant during the Jan to Feb 2023. After this, the ratio of approved visas rate plunged to, and levelled off, at 2% in Mar 2023. Following a similar pattern, it dropped to less than 2% in Apr 2023. It had an upswing to 8% sharply in May 2023.
For the Jun, Jul and Aug 2023 showed some fluctuation between 6% to 8%. There was rapidly decline in Aug to Sep at about 4%. It skyrocketed to a peak of 16% with the four-fold growth showing figure in Oct 2023. After that, it had a fluctuations of about 1% to 2% at the end of 2023 and Jan 2024.
The three parallel lines graph shows the predictions with 70% accuracy. The lowest line of the lower Confidence Bound has a value of 8.69%, the highest line of the upper Confidence Bound has a value of 15.43% and the middle line of the normal forecast has a value of 12.06%. It is estimated to sank dramatically from Jan 2024 to Feb 2024 to about 12% by the middle line. After that, It levelled off and there was a slow increase to Agu 2024. The figures extrapolate that, actual and prognosticated levels of changes rate approved Iranian tourist visas depends on wildly the number of applicants. It seems that the Iranian policy has had a significant impact on the increase in the number of tourist visa applicants and as a result, the quota for receiving it by IRCC has decreased, which has led to a lot of fluctuations in the process. But at one level, there seems to be an attempt to maintain proportionality between the groups.
Key points:
- The most influential factor on obtaining a visa is related to having an invitation letter with a coefficient of +0.44 and the least effect is related to Previous Refusal with a coefficient of -0.18.
- The highest value of the standard error in the factors affecting the receipt of a visa is related to Previous Refusal and is equal to +0.161, and the lowest value of the standard error is related to having an invitation and is equal to +0.043.
- The highest P-value in the factors influencing the receipt of a visa is related to having an invitation and is equal to +1.107, and the lowest P-value is related to the Schengen visa and is equal to +0.0002.
- The highest request in 2022 was for the “Couple” group and in 2023 for the “Woman” group, and the lowest request in 2022 and 2023 was for the “Man & Child” group.
- The highest number of approved visas in 2022 and 2023 are related to the “Couple” group, which made up 89% and 75% of the entire group, respectively, and the lowest number of approved visas in 2022 and 2023 are related to the “Man & Child” groups, which are respectively zero percent and they made up 0.4% of the whole group.
- The highest percentage of approved visas in 2023 compared to 2022 is related to the “Family” group, which has increased by 11%, and the lowest percentage of approved visas in 2023 compared to 2022 is related to the group of “Man & Child”, which has increased by 0.4%. Also, the highest percentage of refused applications in 2023 compared to 2022 was related to the group of “Woman & Child” and is equal 4%, and the lowest percentage of refused applications in 2023 compared to 2022 was related to the group of “Man & Child” and was -1%.
- The highest percentage of approved visa changes is related to the group of “Man & Child”, which has increased by almost 40%, and the lowest percentage of changes is related to the group of “Women & Child”, and “Couple”, each of which has decreased by approximately 14%.
- It is apparent that the average number of visa refusals increased in January 2023 compared to January 2022, and this trend continued significantly in January 2024. But the number of visa applicants also increased dramatically during these two years.
- Between Jan 2023 and Jan 2024, “Man” and “Woman” groups saw a culmination in the number of refusal visas swiftly. For the “Man” group, the number of visas refused skyrocketed, while for the “Woman” group, the number of visas approved and refused was almost equal.
- From an overall perspective, it can be inferred that the number of visas refused is higher than the number of visas approved in January 2024.
- In the group of “Man” and “Family”, the number are almost tripled, in the group of “Women’, there are quadrupled. As a result, between 2022 and 2024, the total number of visa applicants increased on average threefold, which was an increase of 200%.
- While the category of “invitation” was the highest impact on approving visas compared to “previous refused” category that was the lowest. A closer look at the infographic shows that from 2022 to 2024, it soared sharply. There was a sharp rise in “previous refused” category in Jan 2024. It seems that they were applicants who have applied again in 2022 and 2023.
- In “Family” group it rallied the approved visas to 50% and it slipped the refused visas less than a third. Simultaneously, the approved visas in “Couple” group dropped suddenly from 50% to 25% from 2022 to 2023, and then there was a slow increase on the refused visas in “Couple” group.
- Comparing the “Man” and “Woman” groups, it appears that the number of “Woman” applicants has increased more than the number of “Man” applicants. Following this pattern, the number of approved visas for the “Woman” group has increased.
- From 2022 to 2023, the average of applicants soared dramatically. In fact, there was a sharp rise in average of applicant and as a result the refused visas climbed significantly.
- There was downward movement to less than 10% in approved visas from 2022 to 2023. In terms of “Man”, “Woman” and “Family” groups, while the percentage of “Man” and “Woman” were increased about 5%, the figure for “Family” rose suddenly to 20%. Meanwhile, above 40% rise was in “Man & Child group. At the same time, the “Couple” and “Woman & Child” groups, saw more than a 10% decrease in the receipt of approved visas.
- It can be inferred that the approved tourist visas rate displayed approximately the same figures at the beginning and the end of the year 2022, despite wild fluctuation in the middle. It fluctuated significantly during 2023 to 2024.
- The lowest line of the lower Confidence Bound has a value of 8.69%, the highest line of the upper Confidence Bound has a value of 15.43% and the middle line of the normal forecast has a value of 12.06%. It is estimated to sank dramatically from Jan 2024 to Feb 2024 to about 12% by the middle line. After that, It levelled off and there was a slow increase to Aug 2024.
- It seems that the Iranian policy has had a significant impact on the increase in the number of tourist visa applicants and as a result, the quota for receiving it by IRCC has decreased, which has led to a lot of fluctuations in the process. But at one level, there seems to be an attempt to maintain proportionality between the groups.
- In the period from January 2022 to January 2024, among the 1303 applicants for Canadian tourist visas, 786 people succeeded in receiving visas, which is equivalent to 60.32% of the total number in the said period.
- The percentage of increase of 2023 applicants compared to 2022 is 60.59% and the number of 685 people in the period of January 2022 to January 2023, 685 people have succeeded in receiving a Canadian tourist visa, which is equal to 63.48% of the total number of them in the said period.
Results & Recommendations:
- The analysis shows that having an invitation from a credible and justified person had the greatest impact on receiving a Canadian tourist visa. Having a Schengen visa history is second in importance, and according to the P-value, the probability of the result being real is higher than having an invitation. Also, according to the obtained coefficients, having a history of refusal does not have much effect on receiving a visa and it is possible to apply again by improving the case. But due to having the highest error standard in this part, it can be concluded that the distance of the statistics of this part from the actual result is more than other parts and its effect should not be ignored. It is suggested to prepare a larger statistical population of applicants who have had a history of refusing for one or more times as well as more people who have a Schengen visa, and check the new result of their visa for a detailed investigation of this issue.
- Although it seems that the number of refused visas has increased, the total chart shows that the number of visa applicants has increased at the same time. In other words, the policy of Iranians has caused an increase in visa requests, but there has always been a specific algorithm and capacity to maintain the appropriateness of approved and refused visas.
- What is clear is that the gender of the applicants and their characteristics do not have much effect on the result of the visa and only the conditions of the case can have an effect.
- Considering that the existing statistical population is small and the information related to 2024 is only available for one month, it is suggested to conduct the analysis again with a larger statistical population with more information from the applicant groups.
- In the review of Canadian tourist files, other factors such as: Tie, Bank statement, account Activity and the purpose of the travel are also taken into consideration, each of them are the determining factors in the result of the visa. These factors were not investigated in this project and it is suggested to investigate their impact in a more complete project.
- Canada is suitable for tourists due to its cold weather from the end of spring and summer. For this reason, the forecast of the increasing process of issuing visas in the first months of the year can be close to reality. But there are also some unpredictable conditions that are influential in this process, which are out of the scope of our project.
Action:
In this project, I used simple functions, features, and clauses to get my answers:
Aggregate Functions: SUM, AVG, MAX, MIN, COUNT, DIVIDE, MINUS, PERCENT.
Features: TABLES, CONDITIONAL FORMATTING, DATA ANALSIS, DATA CLEANING, PIVOT, CHART, SLICER, TIMELINE.
Clauses: REGRESSION FORMULAS, F SINGNIFICANCE, STANDARD ERROR, INTERCEPT, P-VALUE, R-SQUER, DEPENDENT VARIABLE, INDEPENDENT VARIABLE, FORECAST, COFFICIENTS.
Link:
Thank you so much for reading my project. I will be happy to receive your feedback and opinion about the project. If this project is useful for you, click on this link:
Link to project repository on GitHub